29
/pt/
pt
AIzaSyAYiBZKx7MnpbEhh9jyipgxe19OcubqV5w
April 1, 2024
41682
Latin America & Caribbean
LCN
false
2
1
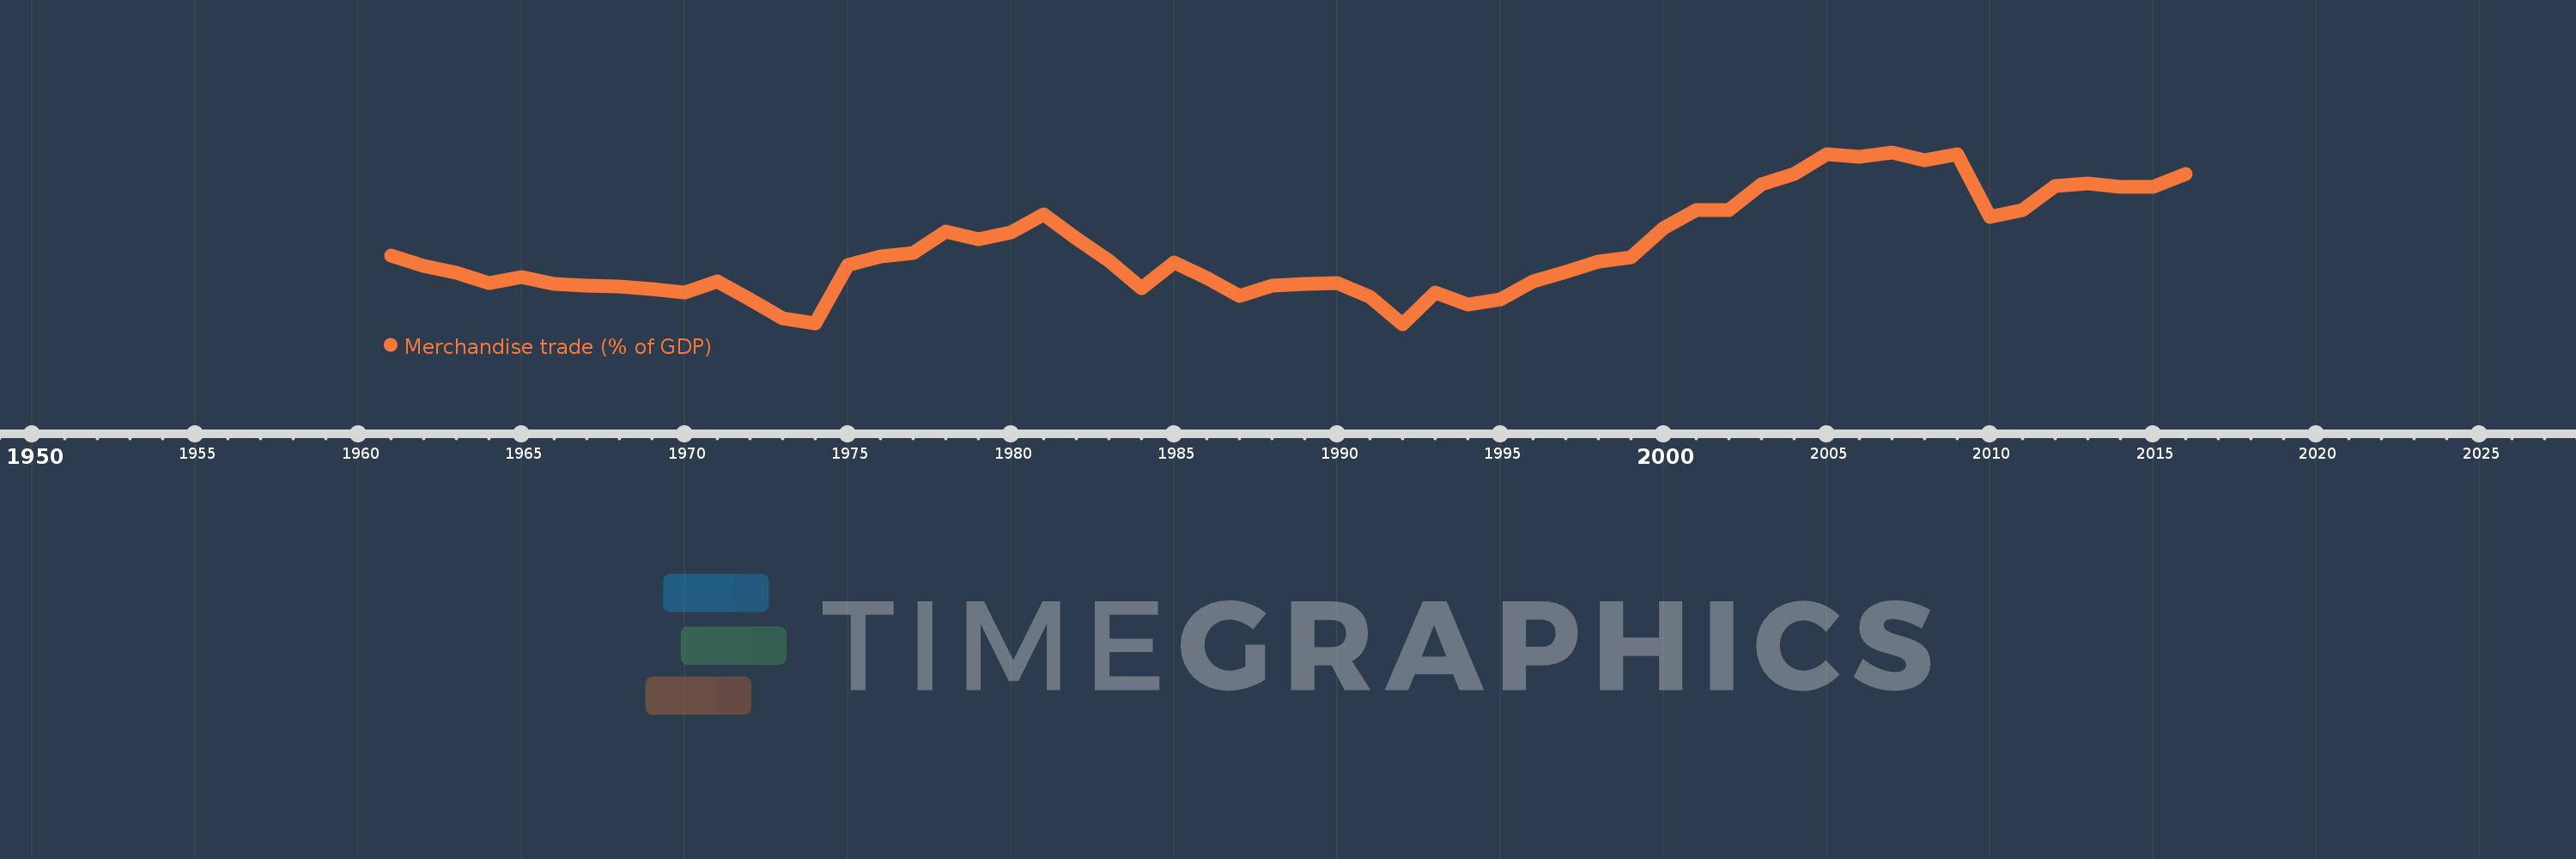
Merchandise trade (% of GDP)
2016,2015,2014,2013,2012,2011,2010,2009,2008,2007,2006,2005,2004,2003,2002,2001,2000,1999,1998,1997,1996,1995,1994,1993,1992,1991,1990,1989,1988,1987,1986,1985,1984,1983,1982,1981,1980,1979,1978,1977,1976,1975,1974,1973,1972,1971,1970,1969,1968,1967,1966,1965,1964,1963,1962,1961
Estas estatísticas em outros países:
AfghanistanAlbaniaAlgeriaAngolaAntigua and BarbudaArab WorldArgentinaArmeniaArubaAustraliaAustriaAzerbaijanBahamas, TheBahrainBangladeshBarbadosBelarusBelgiumBelizeBeninBermudaBhutanBoliviaBosnia and HerzegovinaBotswanaBrazilBrunei DarussalamBulgariaBurkina FasoBurundiCabo VerdeCambodiaCameroonCanadaCaribbean small statesCentral African RepublicCentral Europe and the BalticsChadChileChinaColombiaComorosCongo, Dem. Rep.Congo, Rep.Costa RicaCote d'IvoireCroatiaCubaCyprusCzech RepublicDenmarkDjiboutiDominicaDominican RepublicEarly-demographic dividendEast Asia & PacificEast Asia & Pacific (excluding high income)East Asia & Pacific (IDA & IBRD countries)EcuadorEgypt, Arab Rep.El SalvadorEquatorial GuineaEritreaEstoniaEthiopiaEuro areaEurope & Central AsiaEurope & Central Asia (excluding high income)Europe & Central Asia (IDA & IBRD countries)European UnionFaroe IslandsFijiFinlandFragile and conflict affected situationsFranceFrench PolynesiaGabonGambia, TheGeorgiaGermanyGhanaGreeceGreenlandGrenadaGuatemalaGuineaGuinea-BissauGuyanaHaitiHeavily indebted poor countries (HIPC)High incomeHondurasHong Kong SAR, ChinaHungaryIBRD onlyIcelandIDA & IBRD totalIDA blendIDA onlyIDA totalIndiaIndonesiaIran, Islamic Rep.IraqIrelandIsraelItalyJamaicaJapanJordanKazakhstanKenyaKiribatiKorea, Rep.KuwaitKyrgyz RepublicLao PDRLate-demographic dividendLatin America & Caribbean Latin America & Caribbean (excluding high income)Latin America & the Caribbean (IDA & IBRD countries)LatviaLeast developed countries: UN classificationLebanonLesothoLiberiaLibyaLithuaniaLow & middle incomeLow incomeLower middle incomeLuxembourgMacao SAR, ChinaMacedonia, FYRMadagascarMalawiMalaysiaMaldivesMaliMaltaMarshall IslandsMauritaniaMauritiusMexicoMicronesia, Fed. Sts.Middle East & North AfricaMiddle East & North Africa (excluding high income)Middle East & North Africa (IDA & IBRD countries)Middle incomeMoldovaMongoliaMontenegroMoroccoMozambiqueMyanmarNamibiaNepalNetherlandsNew CaledoniaNew ZealandNicaraguaNigerNigeriaNorth AmericaNorwayOECD membersOmanOther small statesPacific island small statesPakistanPalauPanamaPapua New GuineaParaguayPeruPhilippinesPolandPortugalPost-demographic dividendPre-demographic dividendQatarRomaniaRussian FederationRwandaSamoaSao Tome and PrincipeSaudi ArabiaSenegalSerbiaSeychellesSierra LeoneSingaporeSlovak RepublicSloveniaSmall statesSolomon IslandsSouth AfricaSouth AsiaSouth Asia (IDA & IBRD)SpainSri LankaSt. Kitts and NevisSt. LuciaSt. Vincent and the GrenadinesSub-Saharan Africa Sub-Saharan Africa (excluding high income)Sub-Saharan Africa (IDA & IBRD countries)SudanSurinameSwazilandSwedenSwitzerlandSyrian Arab RepublicTajikistanTanzaniaThailandTimor-LesteTogoTongaTrinidad and TobagoTunisiaTurkeyTurkmenistanTuvaluUgandaUkraineUnited Arab EmiratesUnited KingdomUnited StatesUpper middle incomeUruguayUzbekistanVanuatuVenezuela, RBVietnamWorldYemen, Rep.ZambiaZimbabwe Linha do tempo:
Nesta escala de tempo está apresentado um gráfico de 1961 ano até 2016 ano Latin America & Caribbean . Dados de 1960 ano ausente. O número de observações reais por data: 56.
Fonte (nome):
Indicadores de desenvolvimento mundial
Fonte (organização):
World Trade Organization, and World Bank GDP estimates.
Categorias:
Private Sector, Trade
Foi atualizado:
23 abr 2017 ano
Indicadores de alterações dos valores ao longo dos anos
Mínimo:
20.177
1 jan 1992 ano
Máximo:
41.149
1 jan 2007 ano
Na data de observação
Valor
Mudança absoluta
A alteração em relação ao valor anterior
1 jan 1961 ano
28.605
+28.605
0.0%
1 jan 1962 ano
27.311
-1.294
-4.52%
1 jan 1963 ano
26.416
-0.896
-3.28%
1 jan 1964 ano
25.2
-1.216
-4.6%
1 jan 1965 ano
25.889
+0.69
2.74%
1 jan 1966 ano
25.122
-0.767
-2.96%
1 jan 1967 ano
24.861
-0.261
-1.04%
1 jan 1968 ano
24.774
-0.087
-0.35%
1 jan 1969 ano
24.43
-0.344
-1.39%
1 jan 1970 ano
23.998
-0.432
-1.77%
1 jan 1971 ano
25.42
+1.422
5.92%
1 jan 1972 ano
23.156
-2.265
-8.91%
1 jan 1973 ano
20.867
-2.288
-9.88%
1 jan 1974 ano
20.285
-0.583
-2.79%
1 jan 1975 ano
27.4
+7.116
35.08%
1 jan 1976 ano
28.451
+1.05
3.83%
1 jan 1977 ano
28.819
+0.368
1.29%
1 jan 1978 ano
31.464
+2.646
9.18%
1 jan 1979 ano
30.544
-0.92
-2.92%
1 jan 1980 ano
31.409
+0.865
2.83%
1 jan 1981 ano
33.566
+2.157
6.87%
1 jan 1982 ano
30.603
-2.963
-8.83%
1 jan 1983 ano
27.938
-2.665
-8.71%
1 jan 1984 ano
24.61
-3.328
-11.91%
1 jan 1985 ano
27.71
+3.1
12.6%
1 jan 1986 ano
25.798
-1.911
-6.9%
1 jan 1987 ano
23.624
-2.175
-8.43%
1 jan 1988 ano
24.87
+1.247
5.28%
1 jan 1989 ano
25.069
+0.199
0.8%
1 jan 1990 ano
25.189
+0.12
0.48%
1 jan 1991 ano
23.544
-1.645
-6.53%
1 jan 1992 ano
20.177
-3.367
-14.3%
1 jan 1993 ano
24.043
+3.865
19.16%
1 jan 1994 ano
22.63
-1.413
-5.88%
1 jan 1995 ano
23.177
+0.548
2.42%
1 jan 1996 ano
25.416
+2.239
9.66%
1 jan 1997 ano
26.516
+1.1
4.33%
1 jan 1998 ano
27.873
+1.357
5.12%
1 jan 1999 ano
28.378
+0.504
1.81%
1 jan 2000 ano
31.951
+3.573
12.59%
1 jan 2001 ano
34.15
+2.199
6.88%
1 jan 2002 ano
34.136
-0.014
-0.04%
1 jan 2003 ano
37.239
+3.103
9.09%
1 jan 2004 ano
38.548
+1.309
3.52%
1 jan 2005 ano
40.883
+2.335
6.06%
1 jan 2006 ano
40.653
-0.23
-0.56%
1 jan 2007 ano
41.149
+0.497
1.22%
1 jan 2008 ano
40.168
-0.982
-2.39%
1 jan 2009 ano
40.956
+0.789
1.96%
1 jan 2010 ano
33.234
-7.723
-18.86%
1 jan 2011 ano
34.121
+0.888
2.67%
1 jan 2012 ano
37.027
+2.906
8.52%
1 jan 2013 ano
37.375
+0.348
0.94%
1 jan 2014 ano
36.9
-0.475
-1.27%
1 jan 2015 ano
36.899
-0.001
0.0%
1 jan 2016 ano
38.495
+1.595
4.32%
Classificação de países por estatísticas atuais por anos


Comentários: