29
/pt/
pt
AIzaSyAYiBZKx7MnpbEhh9jyipgxe19OcubqV5w
April 1, 2024
186798
Malawi
MWI
true
2
1
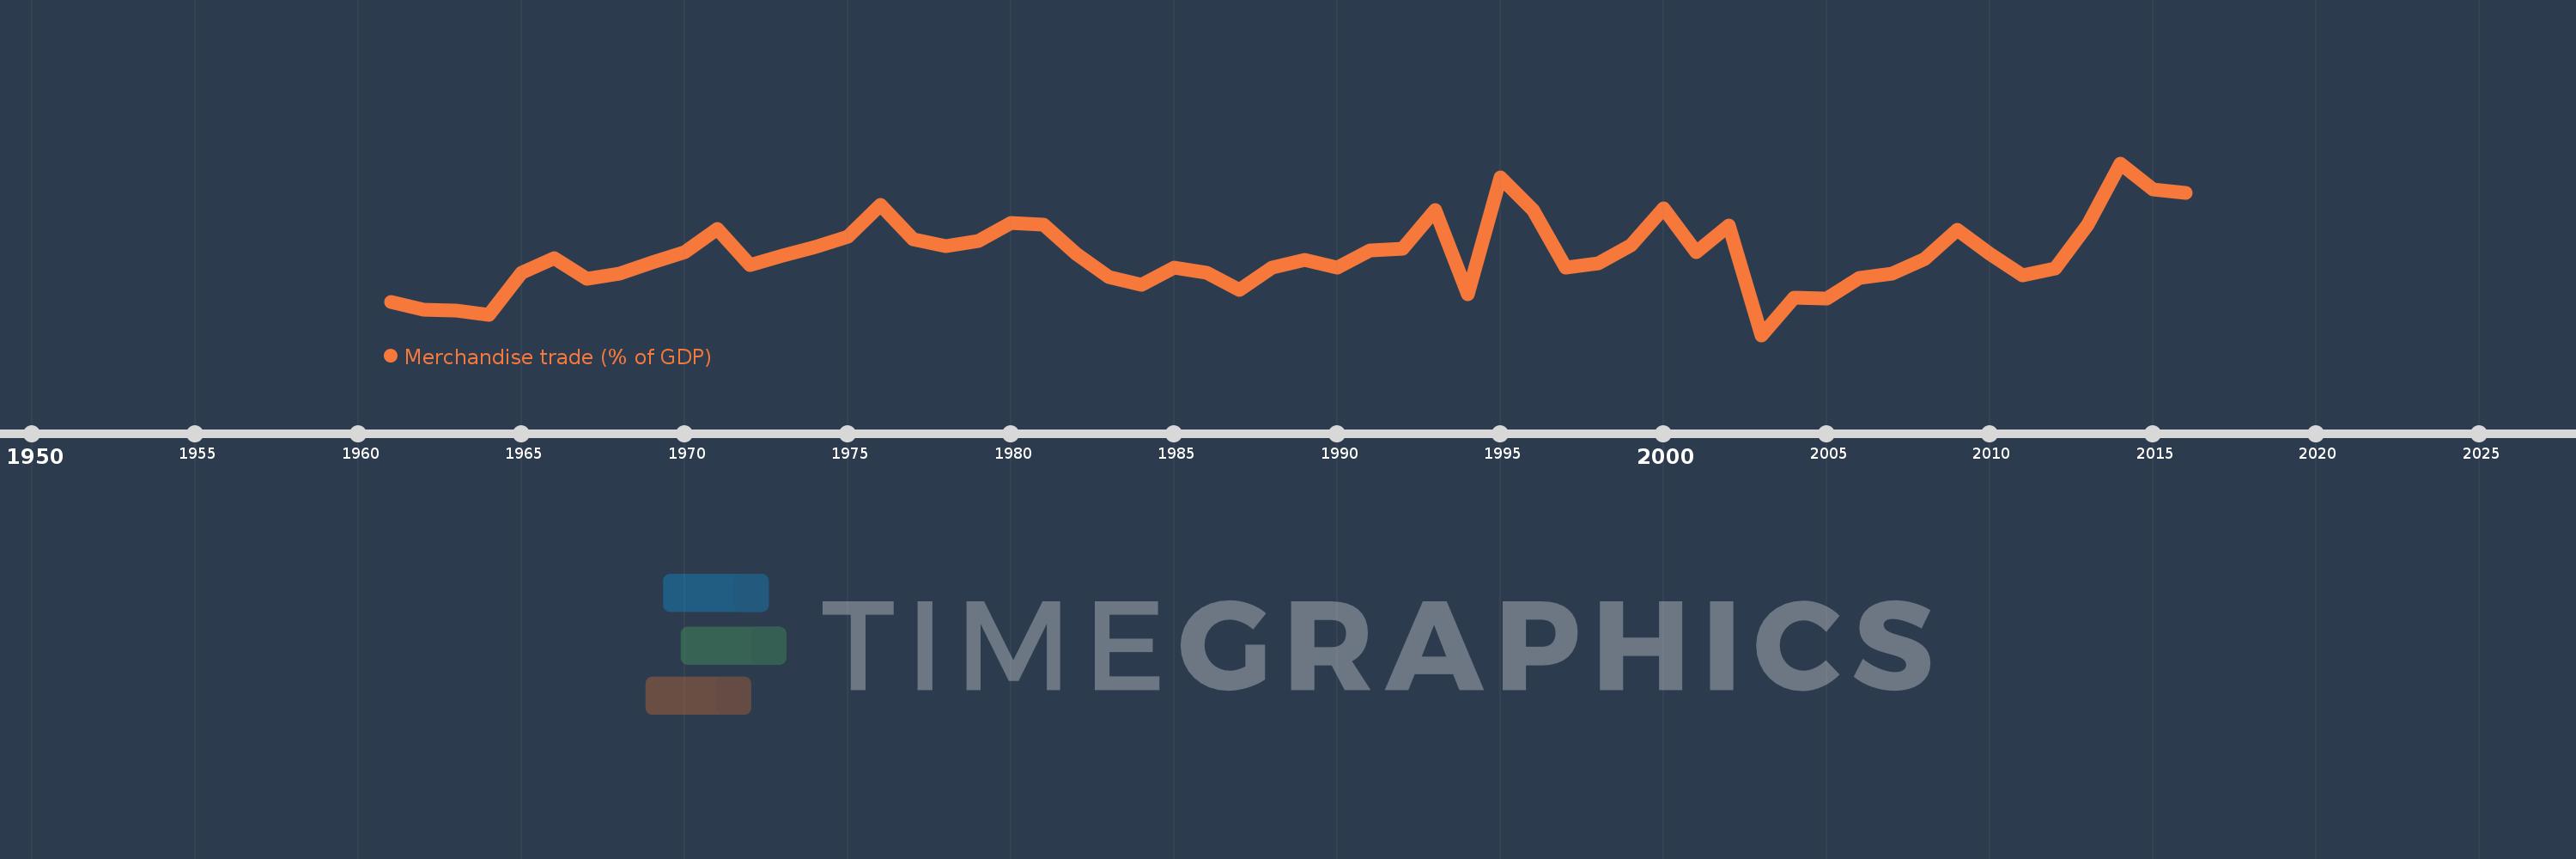
Merchandise trade (% of GDP)
2016,2015,2014,2013,2012,2011,2010,2009,2008,2007,2006,2005,2004,2003,2002,2001,2000,1999,1998,1997,1996,1995,1994,1993,1992,1991,1990,1989,1988,1987,1986,1985,1984,1983,1982,1981,1980,1979,1978,1977,1976,1975,1974,1973,1972,1971,1970,1969,1968,1967,1966,1965,1964,1963,1962,1961
Estas estatísticas em outros países:
AfghanistanAlbaniaAlgeriaAngolaAntigua and BarbudaArab WorldArgentinaArmeniaArubaAustraliaAustriaAzerbaijanBahamas, TheBahrainBangladeshBarbadosBelarusBelgiumBelizeBeninBermudaBhutanBoliviaBosnia and HerzegovinaBotswanaBrazilBrunei DarussalamBulgariaBurkina FasoBurundiCabo VerdeCambodiaCameroonCanadaCaribbean small statesCentral African RepublicCentral Europe and the BalticsChadChileChinaColombiaComorosCongo, Dem. Rep.Congo, Rep.Costa RicaCote d'IvoireCroatiaCubaCyprusCzech RepublicDenmarkDjiboutiDominicaDominican RepublicEarly-demographic dividendEast Asia & PacificEast Asia & Pacific (excluding high income)East Asia & Pacific (IDA & IBRD countries)EcuadorEgypt, Arab Rep.El SalvadorEquatorial GuineaEritreaEstoniaEthiopiaEuro areaEurope & Central AsiaEurope & Central Asia (excluding high income)Europe & Central Asia (IDA & IBRD countries)European UnionFaroe IslandsFijiFinlandFragile and conflict affected situationsFranceFrench PolynesiaGabonGambia, TheGeorgiaGermanyGhanaGreeceGreenlandGrenadaGuatemalaGuineaGuinea-BissauGuyanaHaitiHeavily indebted poor countries (HIPC)High incomeHondurasHong Kong SAR, ChinaHungaryIBRD onlyIcelandIDA & IBRD totalIDA blendIDA onlyIDA totalIndiaIndonesiaIran, Islamic Rep.IraqIrelandIsraelItalyJamaicaJapanJordanKazakhstanKenyaKiribatiKorea, Rep.KuwaitKyrgyz RepublicLao PDRLate-demographic dividendLatin America & Caribbean Latin America & Caribbean (excluding high income)Latin America & the Caribbean (IDA & IBRD countries)LatviaLeast developed countries: UN classificationLebanonLesothoLiberiaLibyaLithuaniaLow & middle incomeLow incomeLower middle incomeLuxembourgMacao SAR, ChinaMacedonia, FYRMadagascarMalawiMalaysiaMaldivesMaliMaltaMarshall IslandsMauritaniaMauritiusMexicoMicronesia, Fed. Sts.Middle East & North AfricaMiddle East & North Africa (excluding high income)Middle East & North Africa (IDA & IBRD countries)Middle incomeMoldovaMongoliaMontenegroMoroccoMozambiqueMyanmarNamibiaNepalNetherlandsNew CaledoniaNew ZealandNicaraguaNigerNigeriaNorth AmericaNorwayOECD membersOmanOther small statesPacific island small statesPakistanPalauPanamaPapua New GuineaParaguayPeruPhilippinesPolandPortugalPost-demographic dividendPre-demographic dividendQatarRomaniaRussian FederationRwandaSamoaSao Tome and PrincipeSaudi ArabiaSenegalSerbiaSeychellesSierra LeoneSingaporeSlovak RepublicSloveniaSmall statesSolomon IslandsSouth AfricaSouth AsiaSouth Asia (IDA & IBRD)SpainSri LankaSt. Kitts and NevisSt. LuciaSt. Vincent and the GrenadinesSub-Saharan Africa Sub-Saharan Africa (excluding high income)Sub-Saharan Africa (IDA & IBRD countries)SudanSurinameSwazilandSwedenSwitzerlandSyrian Arab RepublicTajikistanTanzaniaThailandTimor-LesteTogoTongaTrinidad and TobagoTunisiaTurkeyTurkmenistanTuvaluUgandaUkraineUnited Arab EmiratesUnited KingdomUnited StatesUpper middle incomeUruguayUzbekistanVanuatuVenezuela, RBVietnamWorldYemen, Rep.ZambiaZimbabwe Linha do tempo:
Nesta escala de tempo está apresentado um gráfico de 1961 ano até 2016 ano Malawi. Dados de 1960 ano ausente. O número de observações reais por data: 56.
Fonte (nome):
Indicadores de desenvolvimento mundial
Fonte (organização):
World Trade Organization, and World Bank GDP estimates.
Categorias:
Private Sector, Trade
Foi atualizado:
23 abr 2017 ano
Indicadores de alterações dos valores ao longo dos anos
Mínimo:
31.531
1 jan 2003 ano
Máximo:
74.604
1 jan 2014 ano
Na data de observação
Valor
Mudança absoluta
A alteração em relação ao valor anterior
1 jan 1961 ano
39.887
+39.887
0.0%
1 jan 1962 ano
37.805
-2.082
-5.22%
1 jan 1963 ano
37.68
-0.125
-0.33%
1 jan 1964 ano
36.684
-0.996
-2.64%
1 jan 1965 ano
47.12
+10.436
28.45%
1 jan 1966 ano
50.706
+3.585
7.61%
1 jan 1967 ano
45.597
-5.109
-10.08%
1 jan 1968 ano
46.99
+1.393
3.05%
1 jan 1969 ano
49.785
+2.795
5.95%
1 jan 1970 ano
52.207
+2.422
4.87%
1 jan 1971 ano
58.046
+5.839
11.18%
1 jan 1972 ano
49.105
-8.941
-15.4%
1 jan 1973 ano
51.395
+2.29
4.66%
1 jan 1974 ano
53.549
+2.154
4.19%
1 jan 1975 ano
56.179
+2.63
4.91%
1 jan 1976 ano
64.18
+8.0
14.24%
1 jan 1977 ano
55.537
-8.642
-13.47%
1 jan 1978 ano
53.917
-1.621
-2.92%
1 jan 1979 ano
55.159
+1.242
2.3%
1 jan 1980 ano
59.699
+4.54
8.23%
1 jan 1981 ano
59.305
-0.393
-0.66%
1 jan 1982 ano
51.871
-7.434
-12.54%
1 jan 1983 ano
46.013
-5.858
-11.29%
1 jan 1984 ano
44.146
-1.868
-4.06%
1 jan 1985 ano
48.426
+4.281
9.7%
1 jan 1986 ano
47.2
-1.226
-2.53%
1 jan 1987 ano
42.917
-4.283
-9.07%
1 jan 1988 ano
48.349
+5.431
12.66%
1 jan 1989 ano
50.293
+1.944
4.02%
1 jan 1990 ano
48.422
-1.871
-3.72%
1 jan 1991 ano
52.744
+4.322
8.93%
1 jan 1992 ano
53.187
+0.443
0.84%
1 jan 1993 ano
62.85
+9.663
18.17%
1 jan 1994 ano
41.823
-21.027
-33.46%
1 jan 1995 ano
70.993
+29.171
69.75%
1 jan 1996 ano
62.972
-8.022
-11.3%
1 jan 1997 ano
48.443
-14.529
-23.07%
1 jan 1998 ano
49.489
+1.046
2.16%
1 jan 1999 ano
54.039
+4.55
9.19%
1 jan 2000 ano
63.404
+9.365
17.33%
1 jan 2001 ano
52.251
-11.153
-17.59%
1 jan 2002 ano
58.957
+6.706
12.83%
1 jan 2003 ano
31.531
-27.427
-46.52%
1 jan 2004 ano
40.856
+9.325
29.57%
1 jan 2005 ano
40.725
-0.131
-0.32%
1 jan 2006 ano
45.789
+5.064
12.43%
1 jan 2007 ano
46.901
+1.112
2.43%
1 jan 2008 ano
50.692
+3.791
8.08%
1 jan 2009 ano
57.933
+7.241
14.28%
1 jan 2010 ano
51.806
-6.127
-10.58%
1 jan 2011 ano
46.558
-5.249
-10.13%
1 jan 2012 ano
48.262
+1.704
3.66%
1 jan 2013 ano
59.238
+10.977
22.74%
1 jan 2014 ano
74.604
+15.366
25.94%
1 jan 2015 ano
67.978
-6.625
-8.88%
1 jan 2016 ano
67.254
-0.725
-1.07%
Classificação de países por estatísticas atuais por anos


Comentários: