29
/pt/
pt
AIzaSyAYiBZKx7MnpbEhh9jyipgxe19OcubqV5w
April 1, 2024
258597
Syrian Arab Republic
SYR
true
2
1
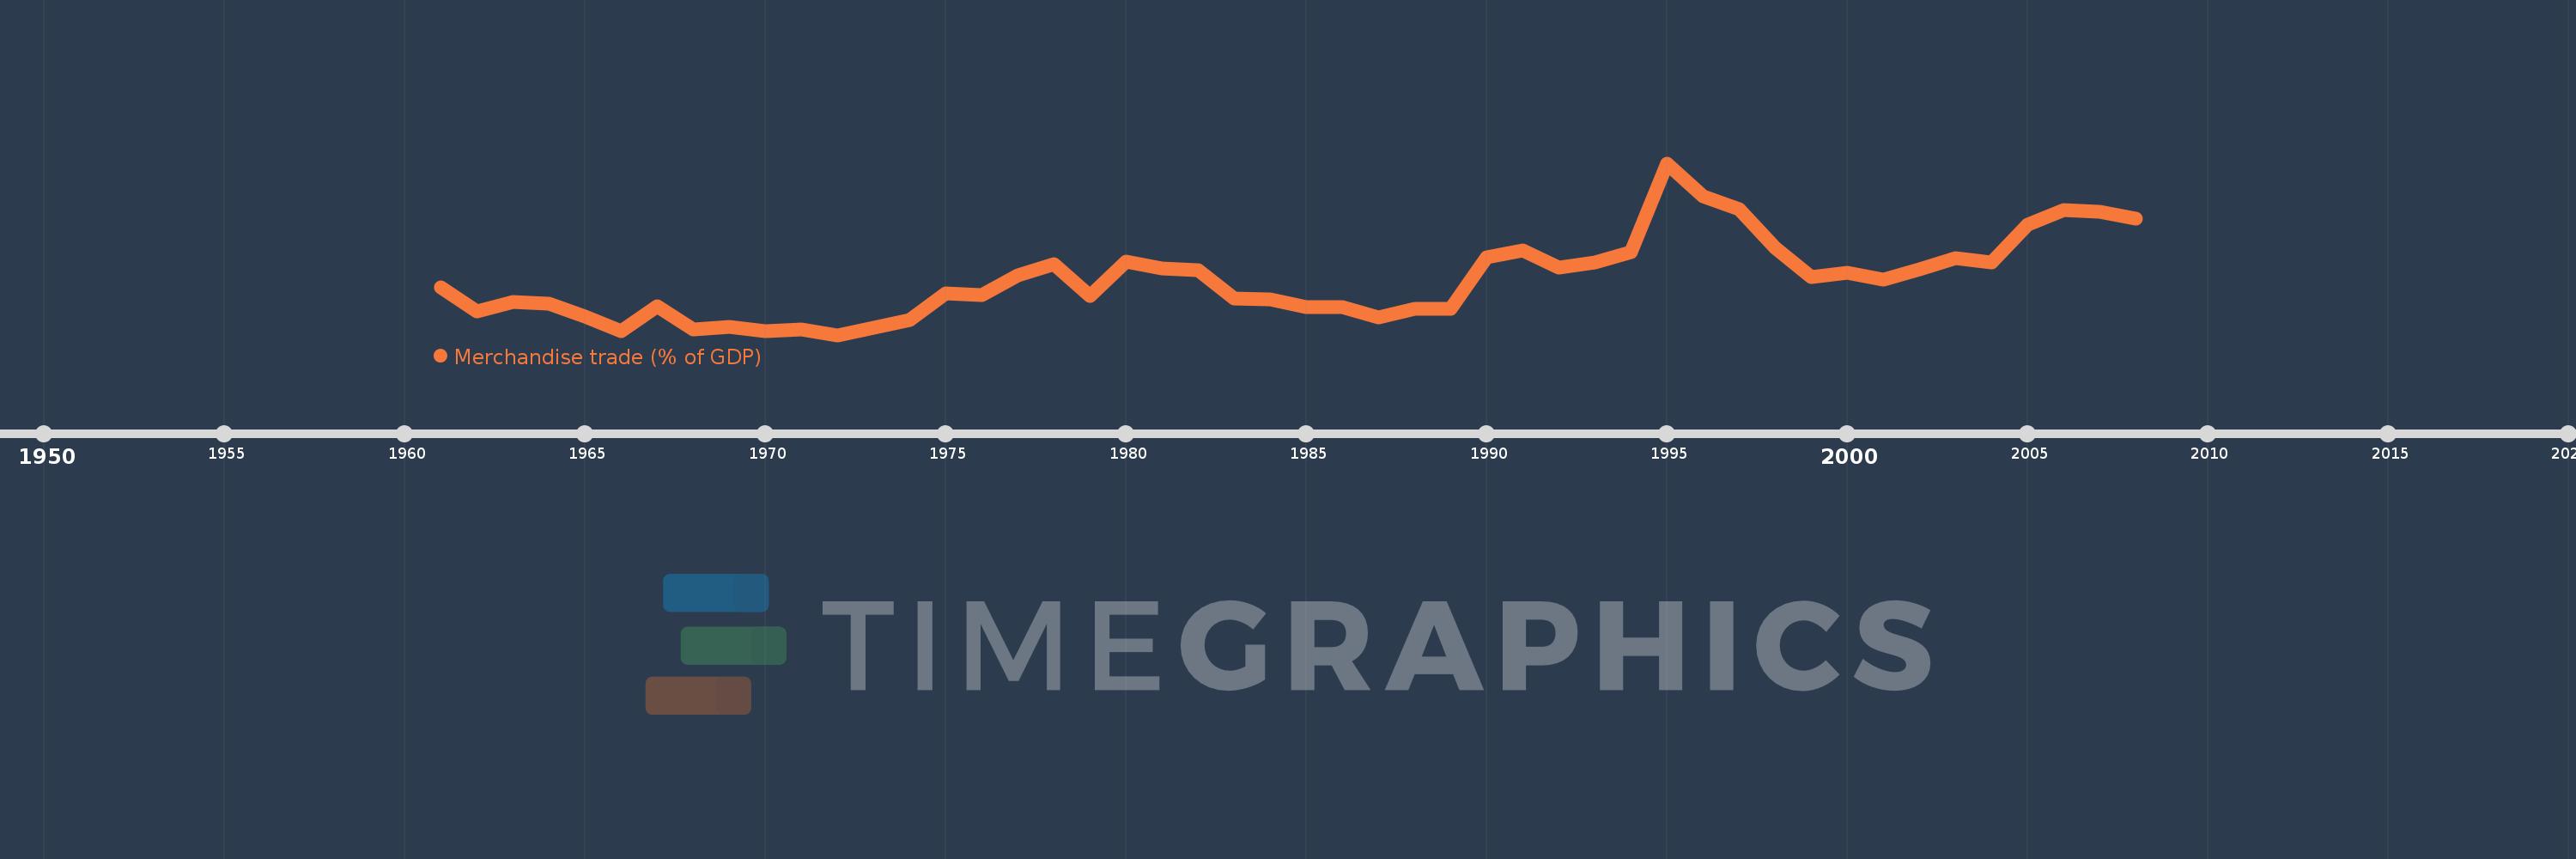
Merchandise trade (% of GDP)
2008,2007,2006,2005,2004,2003,2002,2001,2000,1999,1998,1997,1996,1995,1994,1993,1992,1991,1990,1989,1988,1987,1986,1985,1984,1983,1982,1981,1980,1979,1978,1977,1976,1975,1974,1973,1972,1971,1970,1969,1968,1967,1966,1965,1964,1963,1962,1961
Estas estatísticas em outros países:
AfghanistanAlbaniaAlgeriaAngolaAntigua and BarbudaArab WorldArgentinaArmeniaArubaAustraliaAustriaAzerbaijanBahamas, TheBahrainBangladeshBarbadosBelarusBelgiumBelizeBeninBermudaBhutanBoliviaBosnia and HerzegovinaBotswanaBrazilBrunei DarussalamBulgariaBurkina FasoBurundiCabo VerdeCambodiaCameroonCanadaCaribbean small statesCentral African RepublicCentral Europe and the BalticsChadChileChinaColombiaComorosCongo, Dem. Rep.Congo, Rep.Costa RicaCote d'IvoireCroatiaCubaCyprusCzech RepublicDenmarkDjiboutiDominicaDominican RepublicEarly-demographic dividendEast Asia & PacificEast Asia & Pacific (excluding high income)East Asia & Pacific (IDA & IBRD countries)EcuadorEgypt, Arab Rep.El SalvadorEquatorial GuineaEritreaEstoniaEthiopiaEuro areaEurope & Central AsiaEurope & Central Asia (excluding high income)Europe & Central Asia (IDA & IBRD countries)European UnionFaroe IslandsFijiFinlandFragile and conflict affected situationsFranceFrench PolynesiaGabonGambia, TheGeorgiaGermanyGhanaGreeceGreenlandGrenadaGuatemalaGuineaGuinea-BissauGuyanaHaitiHeavily indebted poor countries (HIPC)High incomeHondurasHong Kong SAR, ChinaHungaryIBRD onlyIcelandIDA & IBRD totalIDA blendIDA onlyIDA totalIndiaIndonesiaIran, Islamic Rep.IraqIrelandIsraelItalyJamaicaJapanJordanKazakhstanKenyaKiribatiKorea, Rep.KuwaitKyrgyz RepublicLao PDRLate-demographic dividendLatin America & Caribbean Latin America & Caribbean (excluding high income)Latin America & the Caribbean (IDA & IBRD countries)LatviaLeast developed countries: UN classificationLebanonLesothoLiberiaLibyaLithuaniaLow & middle incomeLow incomeLower middle incomeLuxembourgMacao SAR, ChinaMacedonia, FYRMadagascarMalawiMalaysiaMaldivesMaliMaltaMarshall IslandsMauritaniaMauritiusMexicoMicronesia, Fed. Sts.Middle East & North AfricaMiddle East & North Africa (excluding high income)Middle East & North Africa (IDA & IBRD countries)Middle incomeMoldovaMongoliaMontenegroMoroccoMozambiqueMyanmarNamibiaNepalNetherlandsNew CaledoniaNew ZealandNicaraguaNigerNigeriaNorth AmericaNorwayOECD membersOmanOther small statesPacific island small statesPakistanPalauPanamaPapua New GuineaParaguayPeruPhilippinesPolandPortugalPost-demographic dividendPre-demographic dividendQatarRomaniaRussian FederationRwandaSamoaSao Tome and PrincipeSaudi ArabiaSenegalSerbiaSeychellesSierra LeoneSingaporeSlovak RepublicSloveniaSmall statesSolomon IslandsSouth AfricaSouth AsiaSouth Asia (IDA & IBRD)SpainSri LankaSt. Kitts and NevisSt. LuciaSt. Vincent and the GrenadinesSub-Saharan Africa Sub-Saharan Africa (excluding high income)Sub-Saharan Africa (IDA & IBRD countries)SudanSurinameSwazilandSwedenSwitzerlandSyrian Arab RepublicTajikistanTanzaniaThailandTimor-LesteTogoTongaTrinidad and TobagoTunisiaTurkeyTurkmenistanTuvaluUgandaUkraineUnited Arab EmiratesUnited KingdomUnited StatesUpper middle incomeUruguayUzbekistanVanuatuVenezuela, RBVietnamWorldYemen, Rep.ZambiaZimbabwe Linha do tempo:
Nesta escala de tempo está apresentado um gráfico de 1961 ano até 2008 ano Syrian Arab Republic. Dados de 1960 ano ausente. O número de observações reais por data: 48.
Fonte (nome):
Indicadores de desenvolvimento mundial
Fonte (organização):
World Trade Organization, and World Bank GDP estimates.
Categorias:
Private Sector, Trade
Foi atualizado:
23 abr 2017 ano
Indicadores de alterações dos valores ao longo dos anos
Mínimo:
24.464
1 jan 1972 ano
Máximo:
84.114
1 jan 1995 ano
Na data de observação
Valor
Mudança absoluta
A alteração em relação ao valor anterior
1 jan 1961 ano
41.103
+41.103
0.0%
1 jan 1962 ano
32.677
-8.425
-20.5%
1 jan 1963 ano
35.813
+3.135
9.6%
1 jan 1964 ano
35.325
-0.488
-1.36%
1 jan 1965 ano
30.732
-4.593
-13.0%
1 jan 1966 ano
25.941
-4.791
-15.59%
1 jan 1967 ano
34.451
+8.51
32.81%
1 jan 1968 ano
26.54
-7.911
-22.96%
1 jan 1969 ano
27.422
+0.882
3.32%
1 jan 1970 ano
25.674
-1.748
-6.37%
1 jan 1971 ano
26.324
+0.65
2.53%
1 jan 1972 ano
24.464
-1.86
-7.06%
1 jan 1973 ano
27.023
+2.559
10.46%
1 jan 1974 ano
29.744
+2.72
10.07%
1 jan 1975 ano
38.938
+9.194
30.91%
1 jan 1976 ano
38.309
-0.629
-1.62%
1 jan 1977 ano
45.288
+6.979
18.22%
1 jan 1978 ano
49.009
+3.721
8.22%
1 jan 1979 ano
37.933
-11.076
-22.6%
1 jan 1980 ano
50.085
+12.152
32.04%
1 jan 1981 ano
47.709
-2.376
-4.74%
1 jan 1982 ano
46.887
-0.822
-1.72%
1 jan 1983 ano
37.144
-9.743
-20.78%
1 jan 1984 ano
36.756
-0.388
-1.04%
1 jan 1985 ano
34.103
-2.653
-7.22%
1 jan 1986 ano
34.182
+0.079
0.23%
1 jan 1987 ano
30.489
-3.692
-10.8%
1 jan 1988 ano
33.585
+3.096
10.15%
1 jan 1989 ano
33.582
-0.003
-0.01%
1 jan 1990 ano
51.454
+17.872
53.22%
1 jan 1991 ano
53.718
+2.264
4.4%
1 jan 1992 ano
47.728
-5.99
-11.15%
1 jan 1993 ano
49.67
+1.941
4.07%
1 jan 1994 ano
53.191
+3.521
7.09%
1 jan 1995 ano
84.114
+30.923
58.14%
1 jan 1996 ano
72.582
-11.531
-13.71%
1 jan 1997 ano
68.015
-4.567
-6.29%
1 jan 1998 ano
54.766
-13.249
-19.48%
1 jan 1999 ano
44.636
-10.131
-18.5%
1 jan 2000 ano
45.962
+1.327
2.97%
1 jan 2001 ano
43.719
-2.244
-4.88%
1 jan 2002 ano
47.394
+3.675
8.41%
1 jan 2003 ano
51.08
+3.686
7.78%
1 jan 2004 ano
49.667
-1.413
-2.77%
1 jan 2005 ano
62.938
+13.271
26.72%
1 jan 2006 ano
67.813
+4.876
7.75%
1 jan 2007 ano
67.224
-0.589
-0.87%
1 jan 2008 ano
64.846
-2.378
-3.54%
Classificação de países por estatísticas atuais por anos


Comentários: