29
/pt/
pt
AIzaSyAYiBZKx7MnpbEhh9jyipgxe19OcubqV5w
April 1, 2024
97594
Cabo Verde
CPV
true
2
1
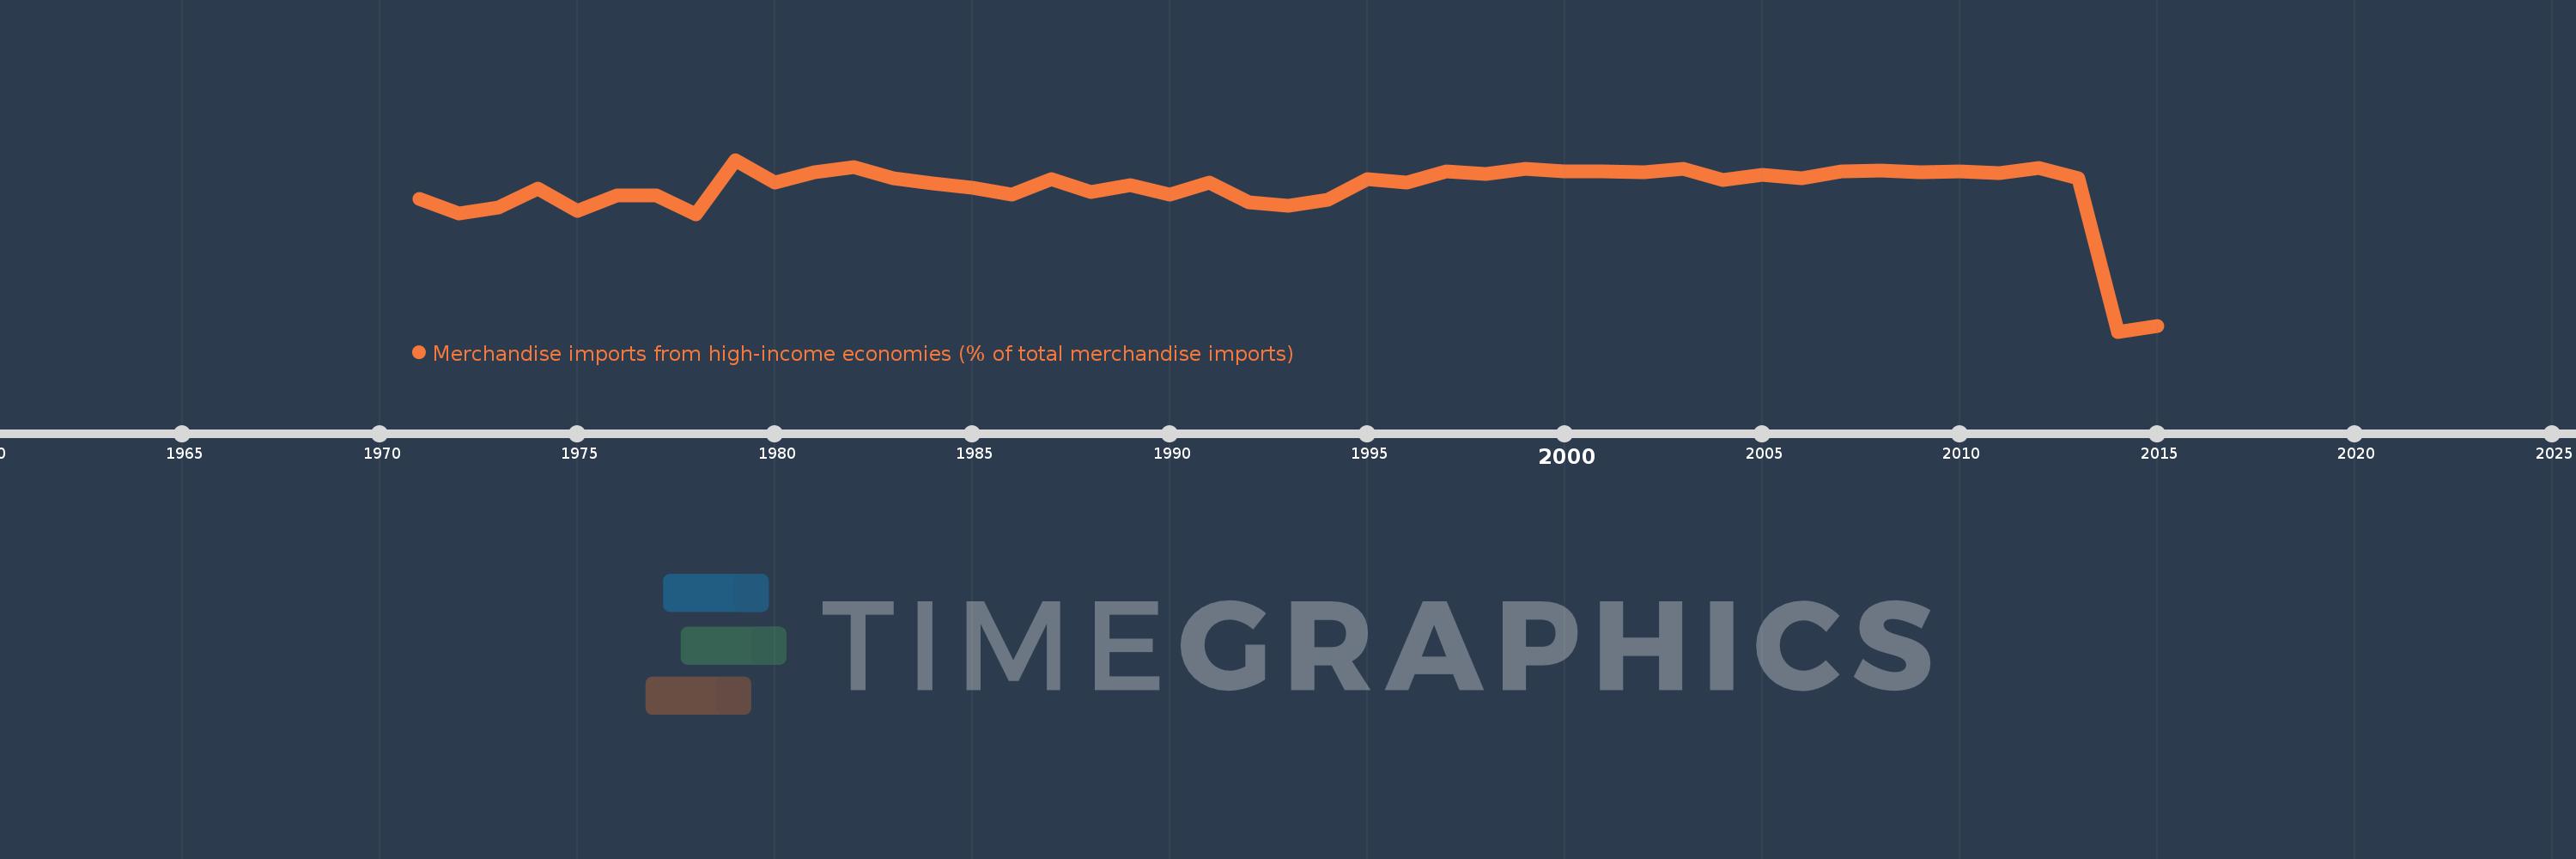
Merchandise imports from high-income economies (% of total merchandise imports)
2015,2014,2013,2012,2011,2010,2009,2008,2007,2006,2005,2004,2003,2002,2001,2000,1999,1998,1997,1996,1995,1994,1993,1992,1991,1990,1989,1988,1987,1986,1985,1984,1983,1982,1981,1980,1979,1978,1977,1976,1975,1974,1973,1972,1971
Estas estatísticas em outros países:
AfghanistanAlbaniaAlgeriaAngolaAntigua and BarbudaArab WorldArgentinaArmeniaArubaAustraliaAustriaAzerbaijanBahamas, TheBahrainBangladeshBarbadosBelarusBelgiumBelizeBeninBermudaBoliviaBosnia and HerzegovinaBrazilBrunei DarussalamBulgariaBurkina FasoBurundiCabo VerdeCambodiaCameroonCanadaCaribbean small statesCentral African RepublicCentral Europe and the BalticsChadChileChinaColombiaComorosCongo, Dem. Rep.Congo, Rep.Costa RicaCote d'IvoireCroatiaCubaCyprusCzech RepublicDenmarkDjiboutiDominicaDominican RepublicEarly-demographic dividendEast Asia & PacificEast Asia & Pacific (excluding high income)East Asia & Pacific (IDA & IBRD countries)EcuadorEgypt, Arab Rep.El SalvadorEquatorial GuineaEstoniaEthiopiaEuro areaEurope & Central AsiaEurope & Central Asia (excluding high income)Europe & Central Asia (IDA & IBRD countries)European UnionFaroe IslandsFijiFinlandFragile and conflict affected situationsFranceFrench PolynesiaGabonGambia, TheGeorgiaGermanyGhanaGibraltarGreeceGreenlandGrenadaGuamGuatemalaGuineaGuinea-BissauGuyanaHaitiHeavily indebted poor countries (HIPC)High incomeHondurasHong Kong SAR, ChinaHungaryIBRD onlyIcelandIDA & IBRD totalIDA blendIDA onlyIDA totalIndiaIndonesiaIran, Islamic Rep.IraqIrelandIsraelItalyJamaicaJapanJordanKazakhstanKenyaKiribatiKorea, Dem. People’s Rep.Korea, Rep.KosovoKuwaitKyrgyz RepublicLao PDRLate-demographic dividendLatin America & Caribbean Latin America & Caribbean (excluding high income)Latin America & the Caribbean (IDA & IBRD countries)LatviaLeast developed countries: UN classificationLebanonLiberiaLibyaLithuaniaLow & middle incomeLow incomeLower middle incomeLuxembourgMacao SAR, ChinaMacedonia, FYRMadagascarMalawiMalaysiaMaldivesMaliMaltaMauritaniaMauritiusMexicoMiddle East & North AfricaMiddle East & North Africa (excluding high income)Middle East & North Africa (IDA & IBRD countries)Middle incomeMoldovaMongoliaMontenegroMoroccoMozambiqueMyanmarNauruNepalNetherlandsNew CaledoniaNew ZealandNicaraguaNigerNigeriaNorth AmericaNorwayOECD membersOmanOther small statesPacific island small statesPakistanPanamaPapua New GuineaParaguayPeruPhilippinesPolandPortugalPost-demographic dividendPre-demographic dividendQatarRomaniaRussian FederationRwandaSamoaSao Tome and PrincipeSaudi ArabiaSenegalSerbiaSeychellesSierra LeoneSingaporeSlovak RepublicSloveniaSmall statesSolomon IslandsSomaliaSouth AfricaSouth AsiaSouth Asia (IDA & IBRD)SpainSri LankaSt. Kitts and NevisSt. LuciaSt. Vincent and the GrenadinesSub-Saharan Africa Sub-Saharan Africa (excluding high income)Sub-Saharan Africa (IDA & IBRD countries)SudanSurinameSwedenSwitzerlandSyrian Arab RepublicTajikistanTanzaniaThailandTogoTongaTrinidad and TobagoTunisiaTurkeyTurkmenistanTuvaluUgandaUkraineUnited Arab EmiratesUnited KingdomUnited StatesUpper middle incomeUruguayUzbekistanVanuatuVenezuela, RBVietnamWorldYemen, Rep.ZambiaZimbabwe Linha do tempo:
Nesta escala de tempo está apresentado um gráfico de 1971 ano até 2015 ano Cabo Verde. Dados de 1970 ano ausente. O número de observações reais por data: 45.
Fonte (nome):
Indicadores de desenvolvimento mundial
Fonte (organização):
World Bank staff estimates based data from International Monetary Fund's Direction of Trade database.
Categorias:
Private Sector, Trade
Foi atualizado:
23 abr 2017 ano
Indicadores de alterações dos valores ao longo dos anos
Mínimo:
20.665
1 jan 2014 ano
Máximo:
90.631
1 jan 1979 ano
Na data de observação
Valor
Mudança absoluta
A alteração em relação ao valor anterior
1 jan 1971 ano
74.545
+74.545
0.0%
1 jan 1972 ano
68.812
-5.734
-7.69%
1 jan 1973 ano
71.193
+2.382
3.46%
1 jan 1974 ano
79.056
+7.863
11.04%
1 jan 1975 ano
69.714
-9.342
-11.82%
1 jan 1976 ano
76.081
+6.367
9.13%
1 jan 1977 ano
76.0
-0.081
-0.11%
1 jan 1978 ano
68.464
-7.536
-9.92%
1 jan 1979 ano
90.631
+22.167
32.38%
1 jan 1980 ano
81.434
-9.197
-10.15%
1 jan 1981 ano
85.505
+4.071
5.0%
1 jan 1982 ano
87.606
+2.101
2.46%
1 jan 1983 ano
83.056
-4.55
-5.19%
1 jan 1984 ano
80.982
-2.073
-2.5%
1 jan 1985 ano
79.149
-1.833
-2.26%
1 jan 1986 ano
76.507
-2.642
-3.34%
1 jan 1987 ano
82.794
+6.287
8.22%
1 jan 1988 ano
77.437
-5.356
-6.47%
1 jan 1989 ano
80.263
+2.826
3.65%
1 jan 1990 ano
76.501
-3.762
-4.69%
1 jan 1991 ano
81.235
+4.735
6.19%
1 jan 1992 ano
73.415
-7.82
-9.63%
1 jan 1993 ano
71.954
-1.461
-1.99%
1 jan 1994 ano
74.535
+2.58
3.59%
1 jan 1995 ano
82.589
+8.054
10.81%
1 jan 1996 ano
81.33
-1.258
-1.52%
1 jan 1997 ano
85.883
+4.553
5.6%
1 jan 1998 ano
84.829
-1.053
-1.23%
1 jan 1999 ano
87.126
+2.297
2.71%
1 jan 2000 ano
85.769
-1.358
-1.56%
1 jan 2001 ano
85.968
+0.199
0.23%
1 jan 2002 ano
85.578
-0.39
-0.45%
1 jan 2003 ano
86.824
+1.246
1.46%
1 jan 2004 ano
82.473
-4.351
-5.01%
1 jan 2005 ano
84.673
+2.2
2.67%
1 jan 2006 ano
83.167
-1.506
-1.78%
1 jan 2007 ano
86.005
+2.838
3.41%
1 jan 2008 ano
86.226
+0.221
0.26%
1 jan 2009 ano
85.576
-0.65
-0.75%
1 jan 2010 ano
85.775
+0.198
0.23%
1 jan 2011 ano
85.353
-0.421
-0.49%
1 jan 2012 ano
87.198
+1.844
2.16%
1 jan 2013 ano
82.994
-4.204
-4.82%
1 jan 2014 ano
20.665
-62.329
-75.1%
1 jan 2015 ano
23.009
+2.344
11.34%
Classificação de países por estatísticas atuais por anos


Comentários: