29
/pt/
pt
AIzaSyAYiBZKx7MnpbEhh9jyipgxe19OcubqV5w
April 1, 2024
274992
United Arab Emirates
ARE
true
2
1
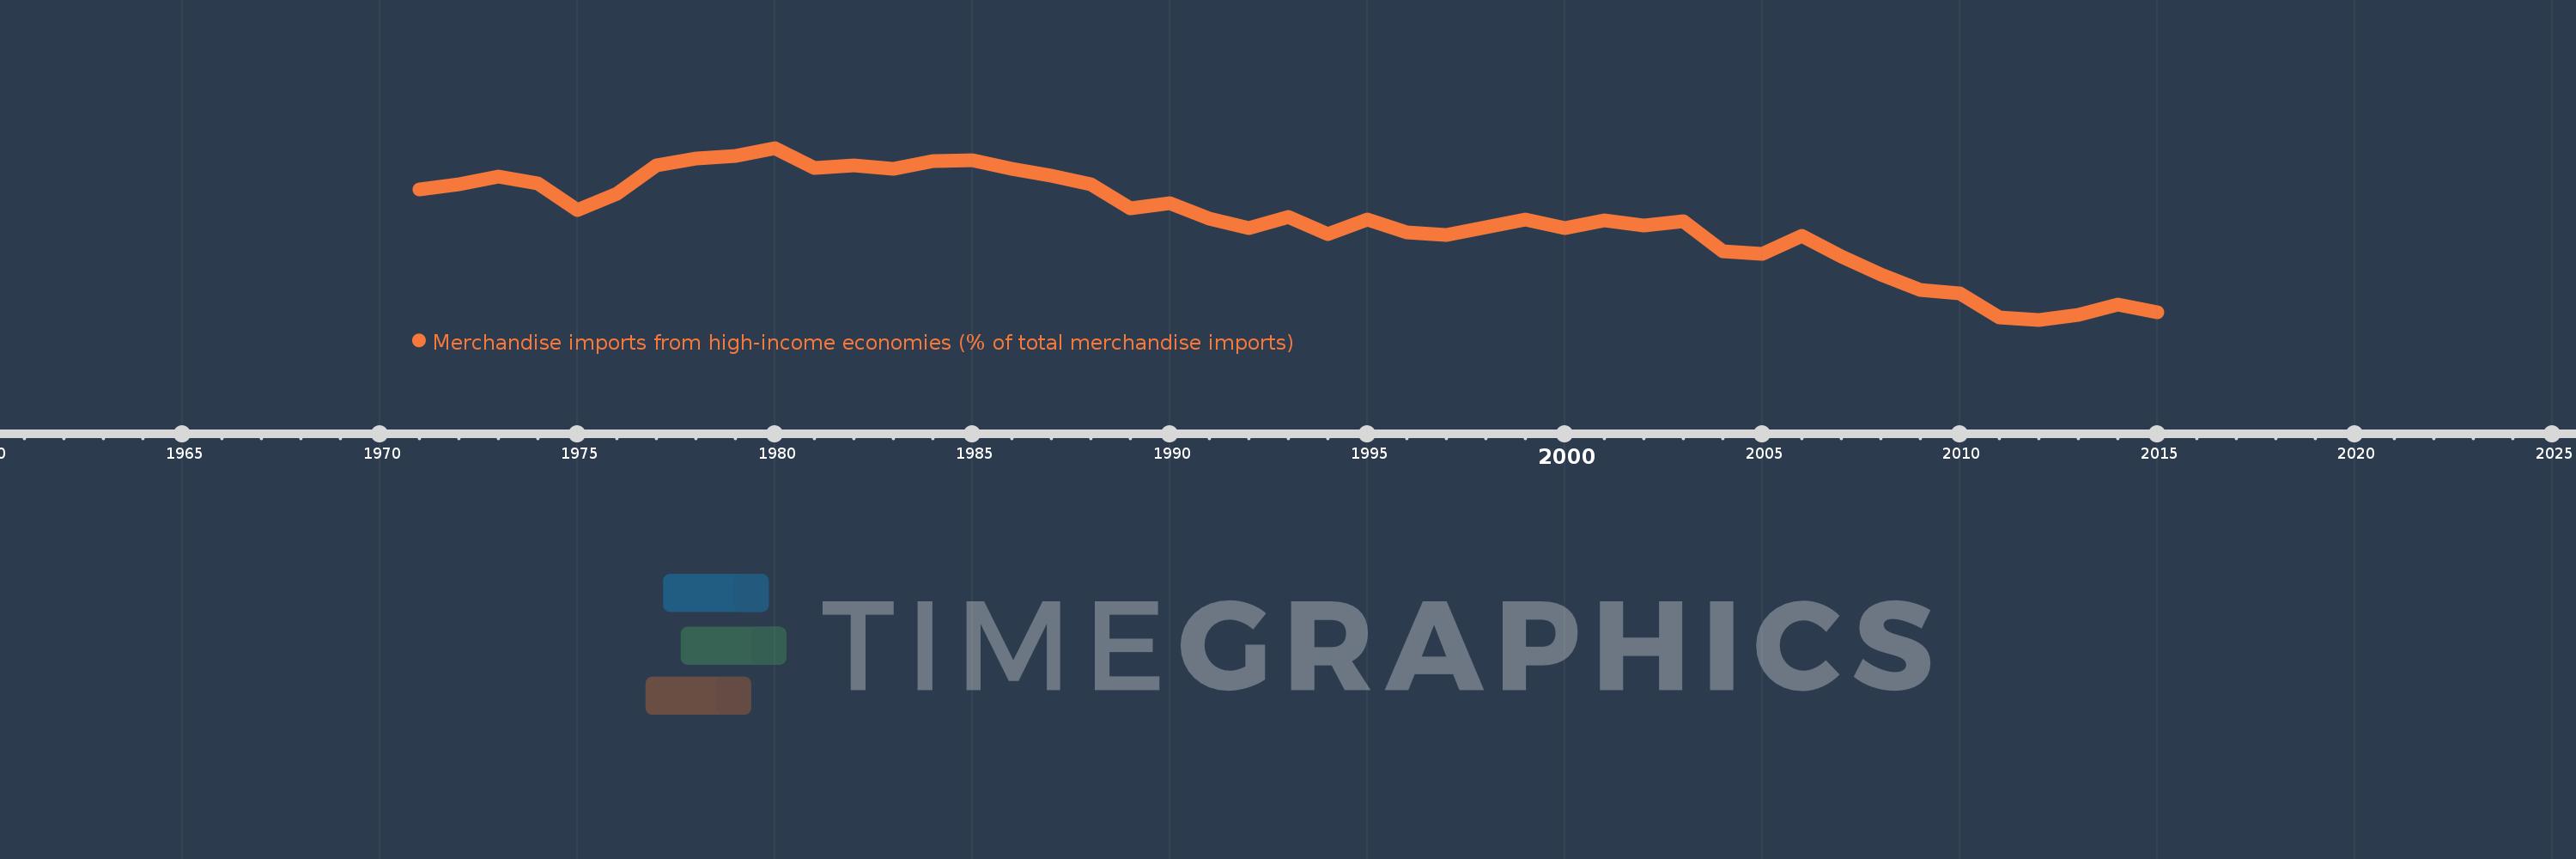
Merchandise imports from high-income economies (% of total merchandise imports)
2015,2014,2013,2012,2011,2010,2009,2008,2007,2006,2005,2004,2003,2002,2001,2000,1999,1998,1997,1996,1995,1994,1993,1992,1991,1990,1989,1988,1987,1986,1985,1984,1983,1982,1981,1980,1979,1978,1977,1976,1975,1974,1973,1972,1971
Estas estatísticas em outros países:
AfghanistanAlbaniaAlgeriaAngolaAntigua and BarbudaArab WorldArgentinaArmeniaArubaAustraliaAustriaAzerbaijanBahamas, TheBahrainBangladeshBarbadosBelarusBelgiumBelizeBeninBermudaBoliviaBosnia and HerzegovinaBrazilBrunei DarussalamBulgariaBurkina FasoBurundiCabo VerdeCambodiaCameroonCanadaCaribbean small statesCentral African RepublicCentral Europe and the BalticsChadChileChinaColombiaComorosCongo, Dem. Rep.Congo, Rep.Costa RicaCote d'IvoireCroatiaCubaCyprusCzech RepublicDenmarkDjiboutiDominicaDominican RepublicEarly-demographic dividendEast Asia & PacificEast Asia & Pacific (excluding high income)East Asia & Pacific (IDA & IBRD countries)EcuadorEgypt, Arab Rep.El SalvadorEquatorial GuineaEstoniaEthiopiaEuro areaEurope & Central AsiaEurope & Central Asia (excluding high income)Europe & Central Asia (IDA & IBRD countries)European UnionFaroe IslandsFijiFinlandFragile and conflict affected situationsFranceFrench PolynesiaGabonGambia, TheGeorgiaGermanyGhanaGibraltarGreeceGreenlandGrenadaGuamGuatemalaGuineaGuinea-BissauGuyanaHaitiHeavily indebted poor countries (HIPC)High incomeHondurasHong Kong SAR, ChinaHungaryIBRD onlyIcelandIDA & IBRD totalIDA blendIDA onlyIDA totalIndiaIndonesiaIran, Islamic Rep.IraqIrelandIsraelItalyJamaicaJapanJordanKazakhstanKenyaKiribatiKorea, Dem. People’s Rep.Korea, Rep.KosovoKuwaitKyrgyz RepublicLao PDRLate-demographic dividendLatin America & Caribbean Latin America & Caribbean (excluding high income)Latin America & the Caribbean (IDA & IBRD countries)LatviaLeast developed countries: UN classificationLebanonLiberiaLibyaLithuaniaLow & middle incomeLow incomeLower middle incomeLuxembourgMacao SAR, ChinaMacedonia, FYRMadagascarMalawiMalaysiaMaldivesMaliMaltaMauritaniaMauritiusMexicoMiddle East & North AfricaMiddle East & North Africa (excluding high income)Middle East & North Africa (IDA & IBRD countries)Middle incomeMoldovaMongoliaMontenegroMoroccoMozambiqueMyanmarNauruNepalNetherlandsNew CaledoniaNew ZealandNicaraguaNigerNigeriaNorth AmericaNorwayOECD membersOmanOther small statesPacific island small statesPakistanPanamaPapua New GuineaParaguayPeruPhilippinesPolandPortugalPost-demographic dividendPre-demographic dividendQatarRomaniaRussian FederationRwandaSamoaSao Tome and PrincipeSaudi ArabiaSenegalSerbiaSeychellesSierra LeoneSingaporeSlovak RepublicSloveniaSmall statesSolomon IslandsSomaliaSouth AfricaSouth AsiaSouth Asia (IDA & IBRD)SpainSri LankaSt. Kitts and NevisSt. LuciaSt. Vincent and the GrenadinesSub-Saharan Africa Sub-Saharan Africa (excluding high income)Sub-Saharan Africa (IDA & IBRD countries)SudanSurinameSwedenSwitzerlandSyrian Arab RepublicTajikistanTanzaniaThailandTogoTongaTrinidad and TobagoTunisiaTurkeyTurkmenistanTuvaluUgandaUkraineUnited Arab EmiratesUnited KingdomUnited StatesUpper middle incomeUruguayUzbekistanVanuatuVenezuela, RBVietnamWorldYemen, Rep.ZambiaZimbabwe Linha do tempo:
Nesta escala de tempo está apresentado um gráfico de 1971 ano até 2015 ano United Arab Emirates. Dados de 1970 ano ausente. O número de observações reais por data: 45.
Fonte (nome):
Indicadores de desenvolvimento mundial
Fonte (organização):
World Bank staff estimates based data from International Monetary Fund's Direction of Trade database.
Categorias:
Private Sector, Trade
Foi atualizado:
23 abr 2017 ano
Indicadores de alterações dos valores ao longo dos anos
Mínimo:
52.028
1 jan 2012 ano
Máximo:
87.984
1 jan 1980 ano
Na data de observação
Valor
Mudança absoluta
A alteração em relação ao valor anterior
1 jan 1971 ano
79.378
+79.378
0.0%
1 jan 1972 ano
80.354
+0.976
1.23%
1 jan 1973 ano
82.03
+1.676
2.09%
1 jan 1974 ano
80.647
-1.382
-1.68%
1 jan 1975 ano
74.993
-5.655
-7.01%
1 jan 1976 ano
78.422
+3.429
4.57%
1 jan 1977 ano
84.247
+5.825
7.43%
1 jan 1978 ano
85.824
+1.576
1.87%
1 jan 1979 ano
86.254
+0.43
0.5%
1 jan 1980 ano
87.984
+1.73
2.01%
1 jan 1981 ano
83.755
-4.229
-4.81%
1 jan 1982 ano
84.364
+0.61
0.73%
1 jan 1983 ano
83.544
-0.82
-0.97%
1 jan 1984 ano
85.15
+1.606
1.92%
1 jan 1985 ano
85.481
+0.331
0.39%
1 jan 1986 ano
83.621
-1.86
-2.18%
1 jan 1987 ano
82.242
-1.379
-1.65%
1 jan 1988 ano
80.365
-1.877
-2.28%
1 jan 1989 ano
75.428
-4.937
-6.14%
1 jan 1990 ano
76.399
+0.971
1.29%
1 jan 1991 ano
73.187
-3.212
-4.2%
1 jan 1992 ano
71.138
-2.048
-2.8%
1 jan 1993 ano
73.573
+2.434
3.42%
1 jan 1994 ano
70.01
-3.563
-4.84%
1 jan 1995 ano
73.055
+3.044
4.35%
1 jan 1996 ano
70.363
-2.691
-3.68%
1 jan 1997 ano
69.723
-0.64
-0.91%
1 jan 1998 ano
71.407
+1.684
2.42%
1 jan 1999 ano
73.047
+1.639
2.3%
1 jan 2000 ano
71.244
-1.803
-2.47%
1 jan 2001 ano
72.855
+1.611
2.26%
1 jan 2002 ano
71.821
-1.034
-1.42%
1 jan 2003 ano
72.696
+0.875
1.22%
1 jan 2004 ano
66.373
-6.323
-8.7%
1 jan 2005 ano
65.803
-0.57
-0.86%
1 jan 2006 ano
69.586
+3.783
5.75%
1 jan 2007 ano
65.213
-4.373
-6.28%
1 jan 2008 ano
61.462
-3.751
-5.75%
1 jan 2009 ano
58.259
-3.202
-5.21%
1 jan 2010 ano
57.47
-0.789
-1.36%
1 jan 2011 ano
52.482
-4.988
-8.68%
1 jan 2012 ano
52.028
-0.455
-0.87%
1 jan 2013 ano
53.119
+1.091
2.1%
1 jan 2014 ano
55.178
+2.059
3.88%
1 jan 2015 ano
53.544
-1.633
-2.96%
Classificação de países por estatísticas atuais por anos


Comentários: