29
/pt/
pt
AIzaSyAYiBZKx7MnpbEhh9jyipgxe19OcubqV5w
April 1, 2024
188081
Malaysia
MYS
true
2
1
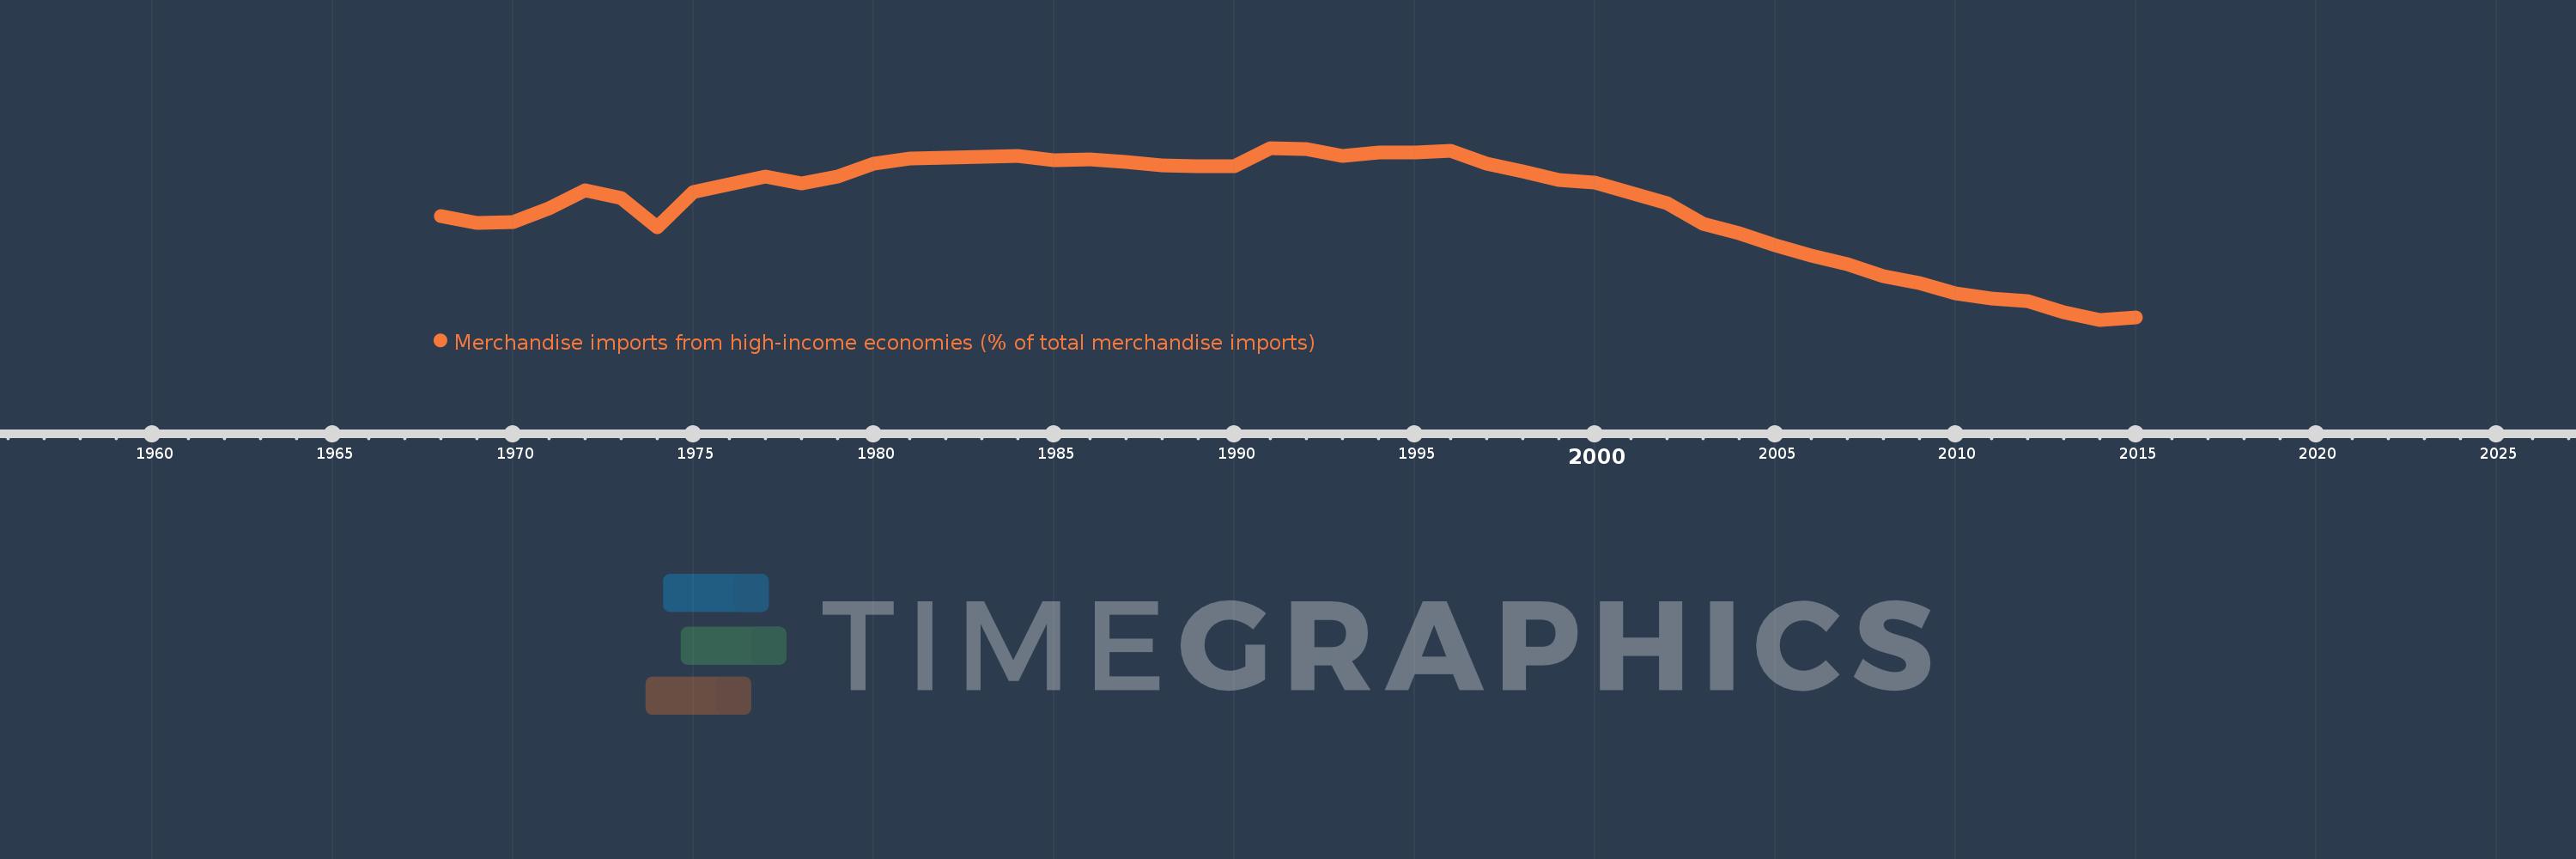
Merchandise imports from high-income economies (% of total merchandise imports)
2015,2014,2013,2012,2011,2010,2009,2008,2007,2006,2005,2004,2003,2002,2001,2000,1999,1998,1997,1996,1995,1994,1993,1992,1991,1990,1989,1988,1987,1986,1985,1984,1983,1982,1981,1980,1979,1978,1977,1976,1975,1974,1973,1972,1971,1970,1969,1968
Estas estatísticas em outros países:
AfghanistanAlbaniaAlgeriaAngolaAntigua and BarbudaArab WorldArgentinaArmeniaArubaAustraliaAustriaAzerbaijanBahamas, TheBahrainBangladeshBarbadosBelarusBelgiumBelizeBeninBermudaBoliviaBosnia and HerzegovinaBrazilBrunei DarussalamBulgariaBurkina FasoBurundiCabo VerdeCambodiaCameroonCanadaCaribbean small statesCentral African RepublicCentral Europe and the BalticsChadChileChinaColombiaComorosCongo, Dem. Rep.Congo, Rep.Costa RicaCote d'IvoireCroatiaCubaCyprusCzech RepublicDenmarkDjiboutiDominicaDominican RepublicEarly-demographic dividendEast Asia & PacificEast Asia & Pacific (excluding high income)East Asia & Pacific (IDA & IBRD countries)EcuadorEgypt, Arab Rep.El SalvadorEquatorial GuineaEstoniaEthiopiaEuro areaEurope & Central AsiaEurope & Central Asia (excluding high income)Europe & Central Asia (IDA & IBRD countries)European UnionFaroe IslandsFijiFinlandFragile and conflict affected situationsFranceFrench PolynesiaGabonGambia, TheGeorgiaGermanyGhanaGibraltarGreeceGreenlandGrenadaGuamGuatemalaGuineaGuinea-BissauGuyanaHaitiHeavily indebted poor countries (HIPC)High incomeHondurasHong Kong SAR, ChinaHungaryIBRD onlyIcelandIDA & IBRD totalIDA blendIDA onlyIDA totalIndiaIndonesiaIran, Islamic Rep.IraqIrelandIsraelItalyJamaicaJapanJordanKazakhstanKenyaKiribatiKorea, Dem. People’s Rep.Korea, Rep.KosovoKuwaitKyrgyz RepublicLao PDRLate-demographic dividendLatin America & Caribbean Latin America & Caribbean (excluding high income)Latin America & the Caribbean (IDA & IBRD countries)LatviaLeast developed countries: UN classificationLebanonLiberiaLibyaLithuaniaLow & middle incomeLow incomeLower middle incomeLuxembourgMacao SAR, ChinaMacedonia, FYRMadagascarMalawiMalaysiaMaldivesMaliMaltaMauritaniaMauritiusMexicoMiddle East & North AfricaMiddle East & North Africa (excluding high income)Middle East & North Africa (IDA & IBRD countries)Middle incomeMoldovaMongoliaMontenegroMoroccoMozambiqueMyanmarNauruNepalNetherlandsNew CaledoniaNew ZealandNicaraguaNigerNigeriaNorth AmericaNorwayOECD membersOmanOther small statesPacific island small statesPakistanPanamaPapua New GuineaParaguayPeruPhilippinesPolandPortugalPost-demographic dividendPre-demographic dividendQatarRomaniaRussian FederationRwandaSamoaSao Tome and PrincipeSaudi ArabiaSenegalSerbiaSeychellesSierra LeoneSingaporeSlovak RepublicSloveniaSmall statesSolomon IslandsSomaliaSouth AfricaSouth AsiaSouth Asia (IDA & IBRD)SpainSri LankaSt. Kitts and NevisSt. LuciaSt. Vincent and the GrenadinesSub-Saharan Africa Sub-Saharan Africa (excluding high income)Sub-Saharan Africa (IDA & IBRD countries)SudanSurinameSwedenSwitzerlandSyrian Arab RepublicTajikistanTanzaniaThailandTogoTongaTrinidad and TobagoTunisiaTurkeyTurkmenistanTuvaluUgandaUkraineUnited Arab EmiratesUnited KingdomUnited StatesUpper middle incomeUruguayUzbekistanVanuatuVenezuela, RBVietnamWorldYemen, Rep.ZambiaZimbabwe Linha do tempo:
Nesta escala de tempo está apresentado um gráfico de 1968 ano até 2015 ano Malaysia. Dados de 1967 ano ausente. O número de observações reais por data: 48.
Fonte (nome):
Indicadores de desenvolvimento mundial
Fonte (organização):
World Bank staff estimates based data from International Monetary Fund's Direction of Trade database.
Categorias:
Private Sector, Trade
Foi atualizado:
23 abr 2017 ano
Indicadores de alterações dos valores ao longo dos anos
Mínimo:
61.766
1 jan 2014 ano
Máximo:
89.38
1 jan 1991 ano
Na data de observação
Valor
Mudança absoluta
A alteração em relação ao valor anterior
1 jan 1968 ano
78.41
+78.41
0.0%
1 jan 1969 ano
77.312
-1.098
-1.4%
1 jan 1970 ano
77.487
+0.175
0.23%
1 jan 1971 ano
79.681
+2.194
2.83%
1 jan 1972 ano
82.612
+2.931
3.68%
1 jan 1973 ano
81.315
-1.297
-1.57%
1 jan 1974 ano
76.601
-4.714
-5.8%
1 jan 1975 ano
82.272
+5.671
7.4%
1 jan 1976 ano
83.581
+1.309
1.59%
1 jan 1977 ano
84.733
+1.152
1.38%
1 jan 1978 ano
83.703
-1.03
-1.22%
1 jan 1979 ano
84.781
+1.078
1.29%
1 jan 1980 ano
86.907
+2.126
2.51%
1 jan 1981 ano
87.655
+0.749
0.86%
1 jan 1982 ano
87.863
+0.208
0.24%
1 jan 1983 ano
88.003
+0.14
0.16%
1 jan 1984 ano
88.054
+0.051
0.06%
1 jan 1985 ano
87.447
-0.607
-0.69%
1 jan 1986 ano
87.484
+0.037
0.04%
1 jan 1987 ano
87.088
-0.396
-0.45%
1 jan 1988 ano
86.561
-0.527
-0.6%
1 jan 1989 ano
86.498
-0.063
-0.07%
1 jan 1990 ano
86.501
+0.003
0.0%
1 jan 1991 ano
89.38
+2.879
3.33%
1 jan 1992 ano
89.235
-0.146
-0.16%
1 jan 1993 ano
88.153
-1.082
-1.21%
1 jan 1994 ano
88.695
+0.542
0.61%
1 jan 1995 ano
88.586
-0.11
-0.12%
1 jan 1996 ano
88.901
+0.315
0.36%
1 jan 1997 ano
86.886
-2.015
-2.27%
1 jan 1998 ano
85.678
-1.208
-1.39%
1 jan 1999 ano
84.173
-1.505
-1.76%
1 jan 2000 ano
83.807
-0.366
-0.43%
1 jan 2001 ano
82.223
-1.584
-1.89%
1 jan 2002 ano
80.495
-1.727
-2.1%
1 jan 2003 ano
77.175
-3.32
-4.12%
1 jan 2004 ano
75.66
-1.515
-1.96%
1 jan 2005 ano
73.693
-1.967
-2.6%
1 jan 2006 ano
72.144
-1.549
-2.1%
1 jan 2007 ano
70.744
-1.4
-1.94%
1 jan 2008 ano
68.713
-2.031
-2.87%
1 jan 2009 ano
67.69
-1.023
-1.49%
1 jan 2010 ano
66.007
-1.683
-2.49%
1 jan 2011 ano
65.149
-0.858
-1.3%
1 jan 2012 ano
64.786
-0.363
-0.56%
1 jan 2013 ano
63.032
-1.754
-2.71%
1 jan 2014 ano
61.766
-1.267
-2.01%
1 jan 2015 ano
62.163
+0.397
0.64%
Classificação de países por estatísticas atuais por anos


Comentários: