29
/pt/
pt
AIzaSyAYiBZKx7MnpbEhh9jyipgxe19OcubqV5w
April 1, 2024
277951
Uruguay
URY
true
2
1
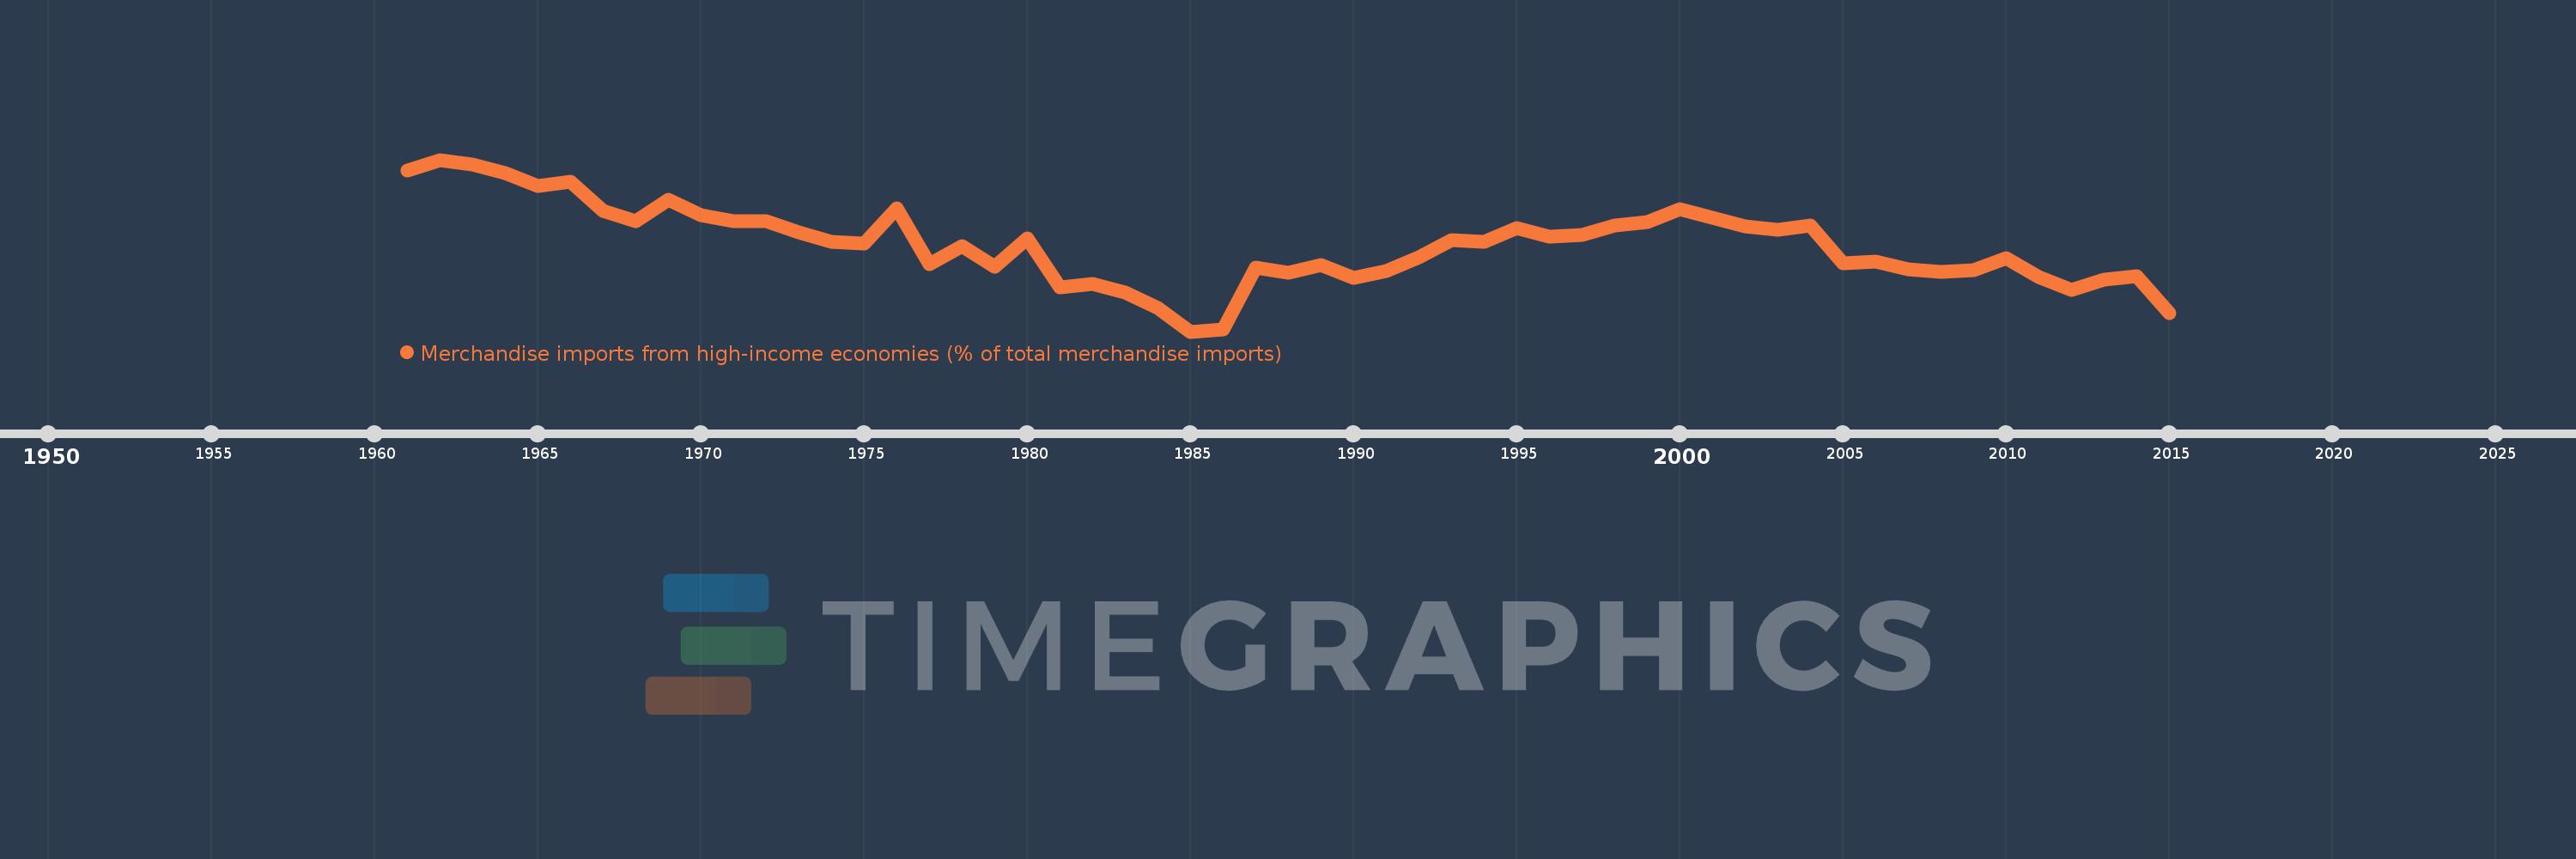
Merchandise imports from high-income economies (% of total merchandise imports)
2015,2014,2013,2012,2011,2010,2009,2008,2007,2006,2005,2004,2003,2002,2001,2000,1999,1998,1997,1996,1995,1994,1993,1992,1991,1990,1989,1988,1987,1986,1985,1984,1983,1982,1981,1980,1979,1978,1977,1976,1975,1974,1973,1972,1971,1970,1969,1968,1967,1966,1965,1964,1963,1962,1961
Estas estatísticas em outros países:
AfghanistanAlbaniaAlgeriaAngolaAntigua and BarbudaArab WorldArgentinaArmeniaArubaAustraliaAustriaAzerbaijanBahamas, TheBahrainBangladeshBarbadosBelarusBelgiumBelizeBeninBermudaBoliviaBosnia and HerzegovinaBrazilBrunei DarussalamBulgariaBurkina FasoBurundiCabo VerdeCambodiaCameroonCanadaCaribbean small statesCentral African RepublicCentral Europe and the BalticsChadChileChinaColombiaComorosCongo, Dem. Rep.Congo, Rep.Costa RicaCote d'IvoireCroatiaCubaCyprusCzech RepublicDenmarkDjiboutiDominicaDominican RepublicEarly-demographic dividendEast Asia & PacificEast Asia & Pacific (excluding high income)East Asia & Pacific (IDA & IBRD countries)EcuadorEgypt, Arab Rep.El SalvadorEquatorial GuineaEstoniaEthiopiaEuro areaEurope & Central AsiaEurope & Central Asia (excluding high income)Europe & Central Asia (IDA & IBRD countries)European UnionFaroe IslandsFijiFinlandFragile and conflict affected situationsFranceFrench PolynesiaGabonGambia, TheGeorgiaGermanyGhanaGibraltarGreeceGreenlandGrenadaGuamGuatemalaGuineaGuinea-BissauGuyanaHaitiHeavily indebted poor countries (HIPC)High incomeHondurasHong Kong SAR, ChinaHungaryIBRD onlyIcelandIDA & IBRD totalIDA blendIDA onlyIDA totalIndiaIndonesiaIran, Islamic Rep.IraqIrelandIsraelItalyJamaicaJapanJordanKazakhstanKenyaKiribatiKorea, Dem. People’s Rep.Korea, Rep.KosovoKuwaitKyrgyz RepublicLao PDRLate-demographic dividendLatin America & Caribbean Latin America & Caribbean (excluding high income)Latin America & the Caribbean (IDA & IBRD countries)LatviaLeast developed countries: UN classificationLebanonLiberiaLibyaLithuaniaLow & middle incomeLow incomeLower middle incomeLuxembourgMacao SAR, ChinaMacedonia, FYRMadagascarMalawiMalaysiaMaldivesMaliMaltaMauritaniaMauritiusMexicoMiddle East & North AfricaMiddle East & North Africa (excluding high income)Middle East & North Africa (IDA & IBRD countries)Middle incomeMoldovaMongoliaMontenegroMoroccoMozambiqueMyanmarNauruNepalNetherlandsNew CaledoniaNew ZealandNicaraguaNigerNigeriaNorth AmericaNorwayOECD membersOmanOther small statesPacific island small statesPakistanPanamaPapua New GuineaParaguayPeruPhilippinesPolandPortugalPost-demographic dividendPre-demographic dividendQatarRomaniaRussian FederationRwandaSamoaSao Tome and PrincipeSaudi ArabiaSenegalSerbiaSeychellesSierra LeoneSingaporeSlovak RepublicSloveniaSmall statesSolomon IslandsSomaliaSouth AfricaSouth AsiaSouth Asia (IDA & IBRD)SpainSri LankaSt. Kitts and NevisSt. LuciaSt. Vincent and the GrenadinesSub-Saharan Africa Sub-Saharan Africa (excluding high income)Sub-Saharan Africa (IDA & IBRD countries)SudanSurinameSwedenSwitzerlandSyrian Arab RepublicTajikistanTanzaniaThailandTogoTongaTrinidad and TobagoTunisiaTurkeyTurkmenistanTuvaluUgandaUkraineUnited Arab EmiratesUnited KingdomUnited StatesUpper middle incomeUruguayUzbekistanVanuatuVenezuela, RBVietnamWorldYemen, Rep.ZambiaZimbabwe Linha do tempo:
Nesta escala de tempo está apresentado um gráfico de 1961 ano até 2015 ano Uruguay. Dados de 1960 ano ausente. O número de observações reais por data: 55.
Fonte (nome):
Indicadores de desenvolvimento mundial
Fonte (organização):
World Bank staff estimates based data from International Monetary Fund's Direction of Trade database.
Categorias:
Private Sector, Trade
Foi atualizado:
23 abr 2017 ano
Indicadores de alterações dos valores ao longo dos anos
Mínimo:
44.57
1 jan 1985 ano
Máximo:
81.661
1 jan 1962 ano
Na data de observação
Valor
Mudança absoluta
A alteração em relação ao valor anterior
1 jan 1961 ano
79.256
+79.256
0.0%
1 jan 1962 ano
81.661
+2.406
3.04%
1 jan 1963 ano
80.652
-1.009
-1.24%
1 jan 1964 ano
78.858
-1.794
-2.22%
1 jan 1965 ano
75.951
-2.907
-3.69%
1 jan 1966 ano
76.851
+0.9
1.18%
1 jan 1967 ano
70.71
-6.142
-7.99%
1 jan 1968 ano
68.47
-2.239
-3.17%
1 jan 1969 ano
73.091
+4.621
6.75%
1 jan 1970 ano
69.785
-3.307
-4.52%
1 jan 1971 ano
68.414
-1.37
-1.96%
1 jan 1972 ano
68.446
+0.032
0.05%
1 jan 1973 ano
65.975
-2.471
-3.61%
1 jan 1974 ano
64.027
-1.948
-2.95%
1 jan 1975 ano
63.562
-0.465
-0.73%
1 jan 1976 ano
71.092
+7.531
11.85%
1 jan 1977 ano
59.145
-11.947
-16.8%
1 jan 1978 ano
63.009
+3.864
6.53%
1 jan 1979 ano
58.568
-4.442
-7.05%
1 jan 1980 ano
64.614
+6.046
10.32%
1 jan 1981 ano
54.185
-10.429
-16.14%
1 jan 1982 ano
54.837
+0.652
1.2%
1 jan 1983 ano
52.992
-1.845
-3.36%
1 jan 1984 ano
49.685
-3.307
-6.24%
1 jan 1985 ano
44.57
-5.115
-10.3%
1 jan 1986 ano
45.099
+0.529
1.19%
1 jan 1987 ano
58.426
+13.327
29.55%
1 jan 1988 ano
57.227
-1.199
-2.05%
1 jan 1989 ano
58.977
+1.75
3.06%
1 jan 1990 ano
56.214
-2.763
-4.69%
1 jan 1991 ano
57.699
+1.485
2.64%
1 jan 1992 ano
60.681
+2.983
5.17%
1 jan 1993 ano
64.352
+3.671
6.05%
1 jan 1994 ano
63.925
-0.427
-0.66%
1 jan 1995 ano
66.889
+2.964
4.64%
1 jan 1996 ano
65.082
-1.807
-2.7%
1 jan 1997 ano
65.358
+0.276
0.42%
1 jan 1998 ano
67.543
+2.185
3.34%
1 jan 1999 ano
68.182
+0.639
0.95%
1 jan 2000 ano
70.98
+2.798
4.1%
1 jan 2001 ano
69.134
-1.847
-2.6%
1 jan 2002 ano
67.221
-1.912
-2.77%
1 jan 2003 ano
66.461
-0.76
-1.13%
1 jan 2004 ano
67.4
+0.938
1.41%
1 jan 2005 ano
59.319
-8.081
-11.99%
1 jan 2006 ano
59.735
+0.416
0.7%
1 jan 2007 ano
57.986
-1.749
-2.93%
1 jan 2008 ano
57.456
-0.53
-0.91%
1 jan 2009 ano
57.75
+0.294
0.51%
1 jan 2010 ano
60.414
+2.663
4.61%
1 jan 2011 ano
56.29
-4.124
-6.83%
1 jan 2012 ano
53.53
-2.76
-4.9%
1 jan 2013 ano
55.847
+2.317
4.33%
1 jan 2014 ano
56.572
+0.725
1.3%
1 jan 2015 ano
48.619
-7.954
-14.06%
Classificação de países por estatísticas atuais por anos


Comentários: