29
/pt/
pt
AIzaSyAYiBZKx7MnpbEhh9jyipgxe19OcubqV5w
April 1, 2024
179126
Liberia
LBR
true
2
1
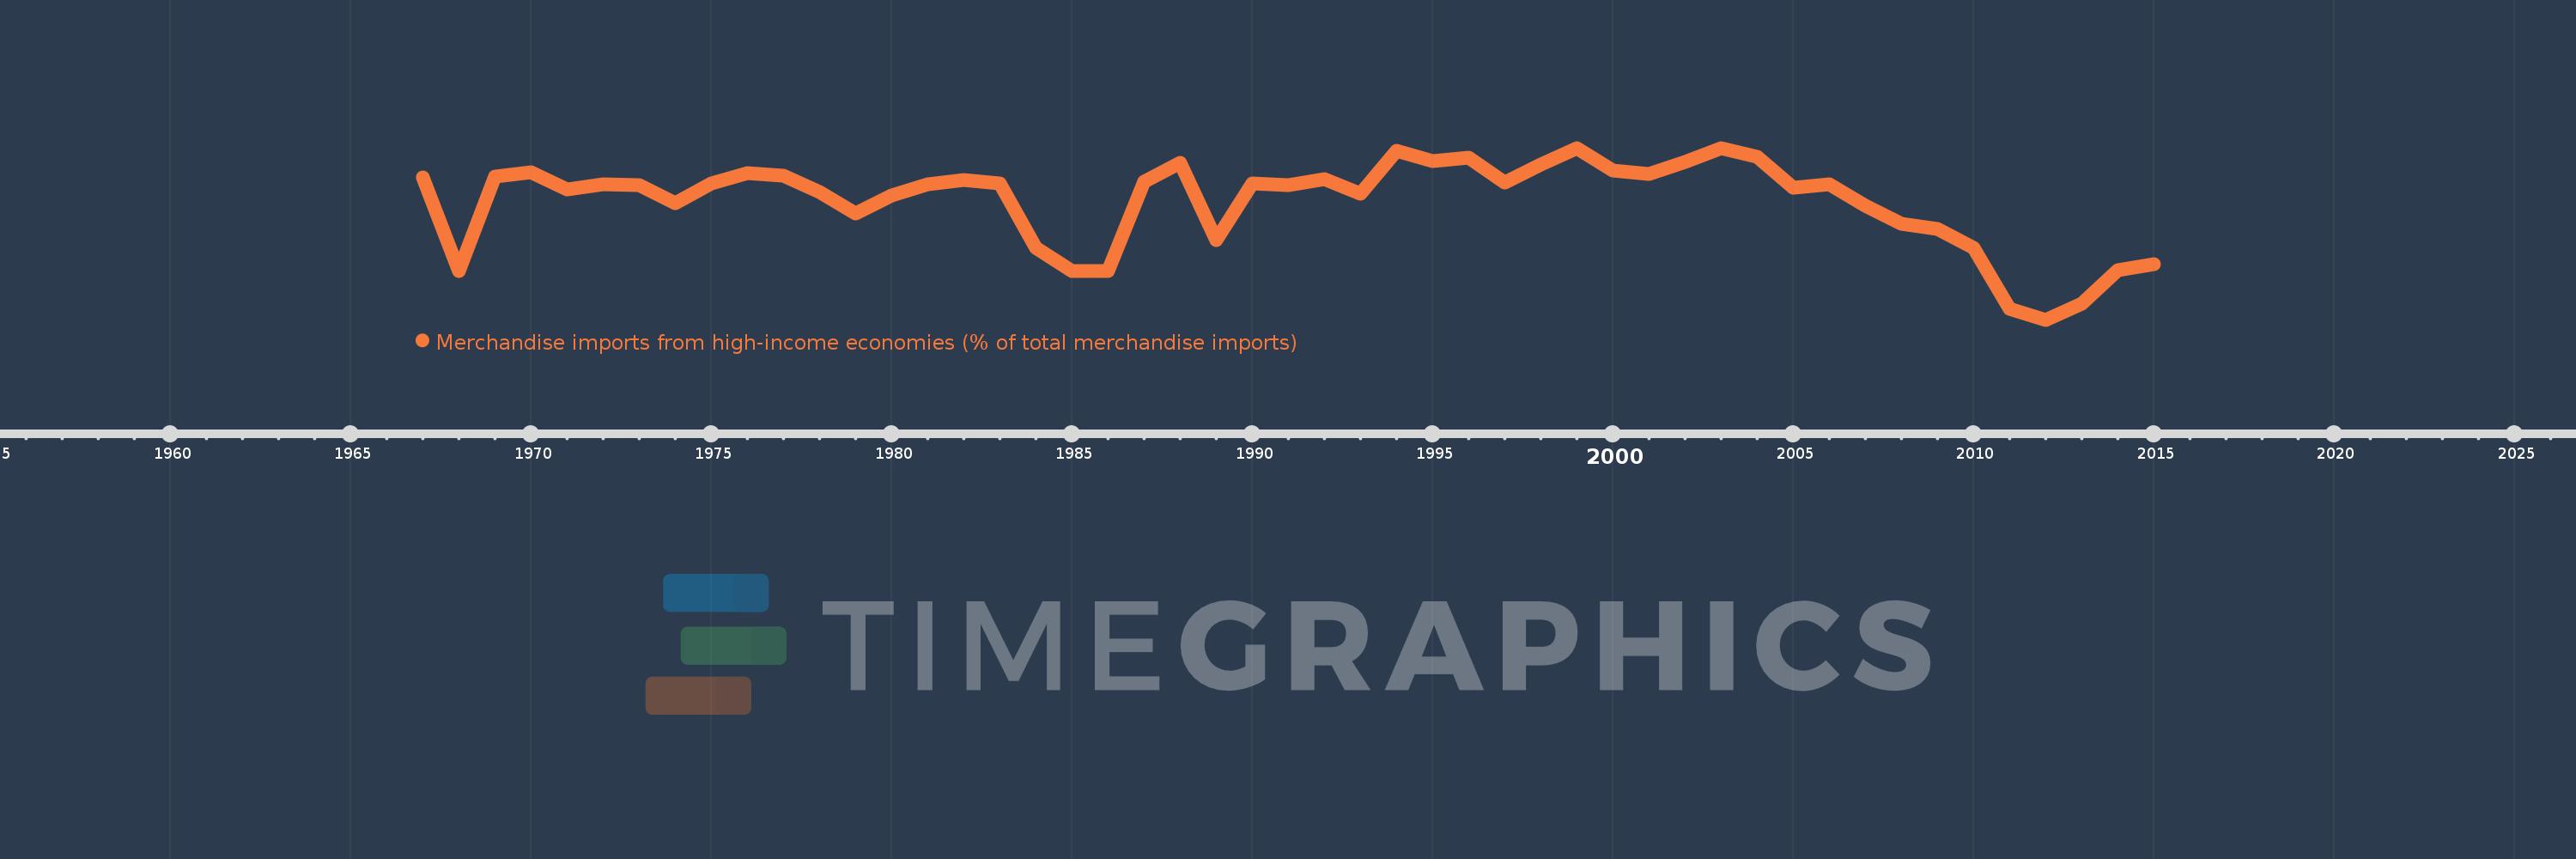
Merchandise imports from high-income economies (% of total merchandise imports)
2015,2014,2013,2012,2011,2010,2009,2008,2007,2006,2005,2004,2003,2002,2001,2000,1999,1998,1997,1996,1995,1994,1993,1992,1991,1990,1989,1988,1987,1986,1985,1984,1983,1982,1981,1980,1979,1978,1977,1976,1975,1974,1973,1972,1971,1970,1969,1968,1967
Estas estatísticas em outros países:
AfghanistanAlbaniaAlgeriaAngolaAntigua and BarbudaArab WorldArgentinaArmeniaArubaAustraliaAustriaAzerbaijanBahamas, TheBahrainBangladeshBarbadosBelarusBelgiumBelizeBeninBermudaBoliviaBosnia and HerzegovinaBrazilBrunei DarussalamBulgariaBurkina FasoBurundiCabo VerdeCambodiaCameroonCanadaCaribbean small statesCentral African RepublicCentral Europe and the BalticsChadChileChinaColombiaComorosCongo, Dem. Rep.Congo, Rep.Costa RicaCote d'IvoireCroatiaCubaCyprusCzech RepublicDenmarkDjiboutiDominicaDominican RepublicEarly-demographic dividendEast Asia & PacificEast Asia & Pacific (excluding high income)East Asia & Pacific (IDA & IBRD countries)EcuadorEgypt, Arab Rep.El SalvadorEquatorial GuineaEstoniaEthiopiaEuro areaEurope & Central AsiaEurope & Central Asia (excluding high income)Europe & Central Asia (IDA & IBRD countries)European UnionFaroe IslandsFijiFinlandFragile and conflict affected situationsFranceFrench PolynesiaGabonGambia, TheGeorgiaGermanyGhanaGibraltarGreeceGreenlandGrenadaGuamGuatemalaGuineaGuinea-BissauGuyanaHaitiHeavily indebted poor countries (HIPC)High incomeHondurasHong Kong SAR, ChinaHungaryIBRD onlyIcelandIDA & IBRD totalIDA blendIDA onlyIDA totalIndiaIndonesiaIran, Islamic Rep.IraqIrelandIsraelItalyJamaicaJapanJordanKazakhstanKenyaKiribatiKorea, Dem. People’s Rep.Korea, Rep.KosovoKuwaitKyrgyz RepublicLao PDRLate-demographic dividendLatin America & Caribbean Latin America & Caribbean (excluding high income)Latin America & the Caribbean (IDA & IBRD countries)LatviaLeast developed countries: UN classificationLebanonLiberiaLibyaLithuaniaLow & middle incomeLow incomeLower middle incomeLuxembourgMacao SAR, ChinaMacedonia, FYRMadagascarMalawiMalaysiaMaldivesMaliMaltaMauritaniaMauritiusMexicoMiddle East & North AfricaMiddle East & North Africa (excluding high income)Middle East & North Africa (IDA & IBRD countries)Middle incomeMoldovaMongoliaMontenegroMoroccoMozambiqueMyanmarNauruNepalNetherlandsNew CaledoniaNew ZealandNicaraguaNigerNigeriaNorth AmericaNorwayOECD membersOmanOther small statesPacific island small statesPakistanPanamaPapua New GuineaParaguayPeruPhilippinesPolandPortugalPost-demographic dividendPre-demographic dividendQatarRomaniaRussian FederationRwandaSamoaSao Tome and PrincipeSaudi ArabiaSenegalSerbiaSeychellesSierra LeoneSingaporeSlovak RepublicSloveniaSmall statesSolomon IslandsSomaliaSouth AfricaSouth AsiaSouth Asia (IDA & IBRD)SpainSri LankaSt. Kitts and NevisSt. LuciaSt. Vincent and the GrenadinesSub-Saharan Africa Sub-Saharan Africa (excluding high income)Sub-Saharan Africa (IDA & IBRD countries)SudanSurinameSwedenSwitzerlandSyrian Arab RepublicTajikistanTanzaniaThailandTogoTongaTrinidad and TobagoTunisiaTurkeyTurkmenistanTuvaluUgandaUkraineUnited Arab EmiratesUnited KingdomUnited StatesUpper middle incomeUruguayUzbekistanVanuatuVenezuela, RBVietnamWorldYemen, Rep.ZambiaZimbabwe Linha do tempo:
Nesta escala de tempo está apresentado um gráfico de 1967 ano até 2015 ano Liberia. Dados de 1966 ano ausente. O número de observações reais por data: 49.
Fonte (nome):
Indicadores de desenvolvimento mundial
Fonte (organização):
World Bank staff estimates based data from International Monetary Fund's Direction of Trade database.
Categorias:
Private Sector, Trade
Foi atualizado:
23 abr 2017 ano
Indicadores de alterações dos valores ao longo dos anos
Mínimo:
67.67
1 jan 2012 ano
Máximo:
97.602
1 jan 2003 ano
Na data de observação
Valor
Mudança absoluta
A alteração em relação ao valor anterior
1 jan 1967 ano
92.533
+92.533
0.0%
1 jan 1968 ano
76.137
-16.397
-17.72%
1 jan 1969 ano
92.579
+16.442
21.6%
1 jan 1970 ano
93.349
+0.77
0.83%
1 jan 1971 ano
90.433
-2.916
-3.12%
1 jan 1972 ano
91.272
+0.839
0.93%
1 jan 1973 ano
91.07
-0.202
-0.22%
1 jan 1974 ano
87.916
-3.154
-3.46%
1 jan 1975 ano
91.4
+3.485
3.96%
1 jan 1976 ano
93.198
+1.798
1.97%
1 jan 1977 ano
92.743
-0.455
-0.49%
1 jan 1978 ano
89.85
-2.893
-3.12%
1 jan 1979 ano
86.184
-3.666
-4.08%
1 jan 1980 ano
89.28
+3.096
3.59%
1 jan 1981 ano
91.321
+2.041
2.29%
1 jan 1982 ano
92.049
+0.728
0.8%
1 jan 1983 ano
91.378
-0.671
-0.73%
1 jan 1984 ano
80.158
-11.22
-12.28%
1 jan 1985 ano
76.149
-4.009
-5.0%
1 jan 1986 ano
76.149
+0.0
0.0%
1 jan 1987 ano
91.683
+15.534
20.4%
1 jan 1988 ano
95.042
+3.359
3.66%
1 jan 1989 ano
81.611
-13.431
-14.13%
1 jan 1990 ano
91.469
+9.858
12.08%
1 jan 1991 ano
91.066
-0.403
-0.44%
1 jan 1992 ano
92.146
+1.08
1.19%
1 jan 1993 ano
89.623
-2.523
-2.74%
1 jan 1994 ano
97.144
+7.521
8.39%
1 jan 1995 ano
95.348
-1.796
-1.85%
1 jan 1996 ano
95.938
+0.59
0.62%
1 jan 1997 ano
91.632
-4.306
-4.49%
1 jan 1998 ano
94.7
+3.067
3.35%
1 jan 1999 ano
97.563
+2.864
3.02%
1 jan 2000 ano
93.738
-3.825
-3.92%
1 jan 2001 ano
93.033
-0.705
-0.75%
1 jan 2002 ano
95.107
+2.074
2.23%
1 jan 2003 ano
97.602
+2.495
2.62%
1 jan 2004 ano
95.99
-1.612
-1.65%
1 jan 2005 ano
90.637
-5.353
-5.58%
1 jan 2006 ano
91.289
+0.652
0.72%
1 jan 2007 ano
87.576
-3.713
-4.07%
1 jan 2008 ano
84.453
-3.122
-3.57%
1 jan 2009 ano
83.558
-0.895
-1.06%
1 jan 2010 ano
80.187
-3.371
-4.03%
1 jan 2011 ano
69.567
-10.621
-13.24%
1 jan 2012 ano
67.67
-1.896
-2.73%
1 jan 2013 ano
70.495
+2.825
4.17%
1 jan 2014 ano
76.262
+5.766
8.18%
1 jan 2015 ano
77.413
+1.151
1.51%
Classificação de países por estatísticas atuais por anos


Comentários: