29
/pt/
pt
AIzaSyAYiBZKx7MnpbEhh9jyipgxe19OcubqV5w
April 1, 2024
157573
Iran, Islamic Rep.
IRN
true
2
1
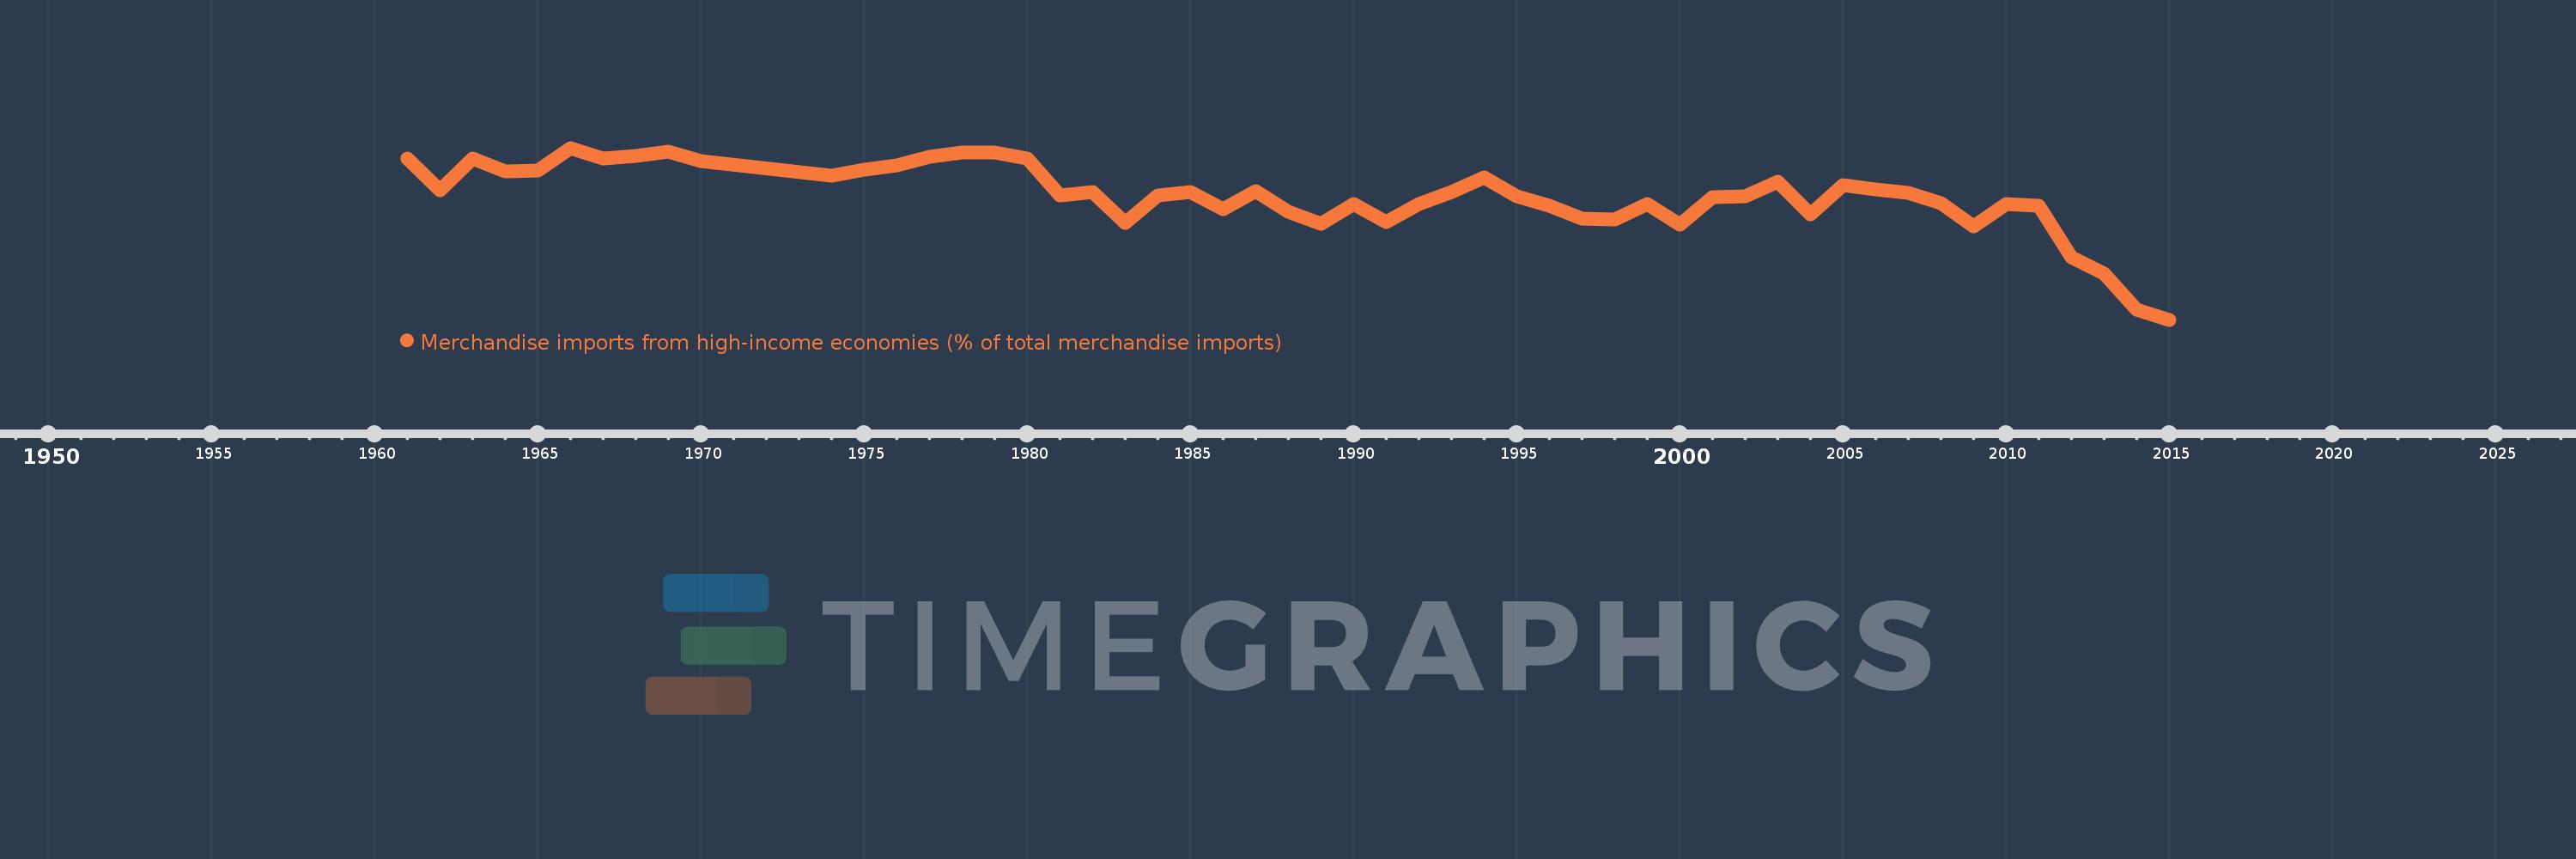
Merchandise imports from high-income economies (% of total merchandise imports)
2015,2014,2013,2012,2011,2010,2009,2008,2007,2006,2005,2004,2003,2002,2001,2000,1999,1998,1997,1996,1995,1994,1993,1992,1991,1990,1989,1988,1987,1986,1985,1984,1983,1982,1981,1980,1979,1978,1977,1976,1975,1974,1970,1969,1968,1967,1966,1965,1964,1963,1962,1961
Estas estatísticas em outros países:
AfghanistanAlbaniaAlgeriaAngolaAntigua and BarbudaArab WorldArgentinaArmeniaArubaAustraliaAustriaAzerbaijanBahamas, TheBahrainBangladeshBarbadosBelarusBelgiumBelizeBeninBermudaBoliviaBosnia and HerzegovinaBrazilBrunei DarussalamBulgariaBurkina FasoBurundiCabo VerdeCambodiaCameroonCanadaCaribbean small statesCentral African RepublicCentral Europe and the BalticsChadChileChinaColombiaComorosCongo, Dem. Rep.Congo, Rep.Costa RicaCote d'IvoireCroatiaCubaCyprusCzech RepublicDenmarkDjiboutiDominicaDominican RepublicEarly-demographic dividendEast Asia & PacificEast Asia & Pacific (excluding high income)East Asia & Pacific (IDA & IBRD countries)EcuadorEgypt, Arab Rep.El SalvadorEquatorial GuineaEstoniaEthiopiaEuro areaEurope & Central AsiaEurope & Central Asia (excluding high income)Europe & Central Asia (IDA & IBRD countries)European UnionFaroe IslandsFijiFinlandFragile and conflict affected situationsFranceFrench PolynesiaGabonGambia, TheGeorgiaGermanyGhanaGibraltarGreeceGreenlandGrenadaGuamGuatemalaGuineaGuinea-BissauGuyanaHaitiHeavily indebted poor countries (HIPC)High incomeHondurasHong Kong SAR, ChinaHungaryIBRD onlyIcelandIDA & IBRD totalIDA blendIDA onlyIDA totalIndiaIndonesiaIran, Islamic Rep.IraqIrelandIsraelItalyJamaicaJapanJordanKazakhstanKenyaKiribatiKorea, Dem. People’s Rep.Korea, Rep.KosovoKuwaitKyrgyz RepublicLao PDRLate-demographic dividendLatin America & Caribbean Latin America & Caribbean (excluding high income)Latin America & the Caribbean (IDA & IBRD countries)LatviaLeast developed countries: UN classificationLebanonLiberiaLibyaLithuaniaLow & middle incomeLow incomeLower middle incomeLuxembourgMacao SAR, ChinaMacedonia, FYRMadagascarMalawiMalaysiaMaldivesMaliMaltaMauritaniaMauritiusMexicoMiddle East & North AfricaMiddle East & North Africa (excluding high income)Middle East & North Africa (IDA & IBRD countries)Middle incomeMoldovaMongoliaMontenegroMoroccoMozambiqueMyanmarNauruNepalNetherlandsNew CaledoniaNew ZealandNicaraguaNigerNigeriaNorth AmericaNorwayOECD membersOmanOther small statesPacific island small statesPakistanPanamaPapua New GuineaParaguayPeruPhilippinesPolandPortugalPost-demographic dividendPre-demographic dividendQatarRomaniaRussian FederationRwandaSamoaSao Tome and PrincipeSaudi ArabiaSenegalSerbiaSeychellesSierra LeoneSingaporeSlovak RepublicSloveniaSmall statesSolomon IslandsSomaliaSouth AfricaSouth AsiaSouth Asia (IDA & IBRD)SpainSri LankaSt. Kitts and NevisSt. LuciaSt. Vincent and the GrenadinesSub-Saharan Africa Sub-Saharan Africa (excluding high income)Sub-Saharan Africa (IDA & IBRD countries)SudanSurinameSwedenSwitzerlandSyrian Arab RepublicTajikistanTanzaniaThailandTogoTongaTrinidad and TobagoTunisiaTurkeyTurkmenistanTuvaluUgandaUkraineUnited Arab EmiratesUnited KingdomUnited StatesUpper middle incomeUruguayUzbekistanVanuatuVenezuela, RBVietnamWorldYemen, Rep.ZambiaZimbabwe Linha do tempo:
Nesta escala de tempo está apresentado um gráfico de 1961 ano até 2015 ano Iran, Islamic Rep.. Dados de 1960 ano ausente. O número de observações reais por data: 52.
Fonte (nome):
Indicadores de desenvolvimento mundial
Fonte (organização):
World Bank staff estimates based data from International Monetary Fund's Direction of Trade database.
Categorias:
Private Sector, Trade
Foi atualizado:
23 abr 2017 ano
Indicadores de alterações dos valores ao longo dos anos
Mínimo:
49.389
1 jan 2015 ano
Máximo:
88.215
1 jan 1966 ano
Na data de observação
Valor
Mudança absoluta
A alteração em relação ao valor anterior
1 jan 1961 ano
85.85
+85.85
0.0%
1 jan 1962 ano
78.62
-7.23
-8.42%
1 jan 1963 ano
85.901
+7.281
9.26%
1 jan 1964 ano
82.981
-2.92
-3.4%
1 jan 1965 ano
83.196
+0.216
0.26%
1 jan 1966 ano
88.215
+5.018
6.03%
1 jan 1967 ano
85.786
-2.428
-2.75%
1 jan 1968 ano
86.333
+0.547
0.64%
1 jan 1969 ano
87.373
+1.039
1.2%
1 jan 1970 ano
85.286
-2.087
-2.39%
1 jan 1974 ano
81.986
-3.3
-3.87%
1 jan 1975 ano
83.394
+1.408
1.72%
1 jan 1976 ano
84.36
+0.966
1.16%
1 jan 1977 ano
86.196
+1.836
2.18%
1 jan 1978 ano
87.278
+1.082
1.26%
1 jan 1979 ano
87.245
-0.034
-0.04%
1 jan 1980 ano
85.91
-1.334
-1.53%
1 jan 1981 ano
77.454
-8.456
-9.84%
1 jan 1982 ano
78.202
+0.748
0.97%
1 jan 1983 ano
71.271
-6.931
-8.86%
1 jan 1984 ano
77.523
+6.252
8.77%
1 jan 1985 ano
78.253
+0.73
0.94%
1 jan 1986 ano
74.43
-3.823
-4.89%
1 jan 1987 ano
78.407
+3.977
5.34%
1 jan 1988 ano
73.775
-4.632
-5.91%
1 jan 1989 ano
71.093
-2.682
-3.64%
1 jan 1990 ano
75.459
+4.366
6.14%
1 jan 1991 ano
71.453
-4.006
-5.31%
1 jan 1992 ano
75.597
+4.144
5.8%
1 jan 1993 ano
78.27
+2.674
3.54%
1 jan 1994 ano
81.508
+3.238
4.14%
1 jan 1995 ano
77.36
-4.148
-5.09%
1 jan 1996 ano
75.06
-2.3
-2.97%
1 jan 1997 ano
72.301
-2.759
-3.68%
1 jan 1998 ano
72.062
-0.239
-0.33%
1 jan 1999 ano
75.613
+3.551
4.93%
1 jan 2000 ano
70.867
-4.746
-6.28%
1 jan 2001 ano
77.182
+6.316
8.91%
1 jan 2002 ano
77.208
+0.026
0.03%
1 jan 2003 ano
80.565
+3.357
4.35%
1 jan 2004 ano
73.26
-7.305
-9.07%
1 jan 2005 ano
79.893
+6.633
9.05%
1 jan 2006 ano
78.835
-1.058
-1.32%
1 jan 2007 ano
78.069
-0.765
-0.97%
1 jan 2008 ano
75.73
-2.339
-3.0%
1 jan 2009 ano
70.445
-5.286
-6.98%
1 jan 2010 ano
75.629
+5.184
7.36%
1 jan 2011 ano
75.101
-0.528
-0.7%
1 jan 2012 ano
63.437
-11.665
-15.53%
1 jan 2013 ano
59.749
-3.688
-5.81%
1 jan 2014 ano
51.611
-8.138
-13.62%
1 jan 2015 ano
49.389
-2.222
-4.31%
Classificação de países por estatísticas atuais por anos


Comentários: