29
/pt/
pt
AIzaSyAYiBZKx7MnpbEhh9jyipgxe19OcubqV5w
April 1, 2024
51127
Middle income
MIC
false
2
1
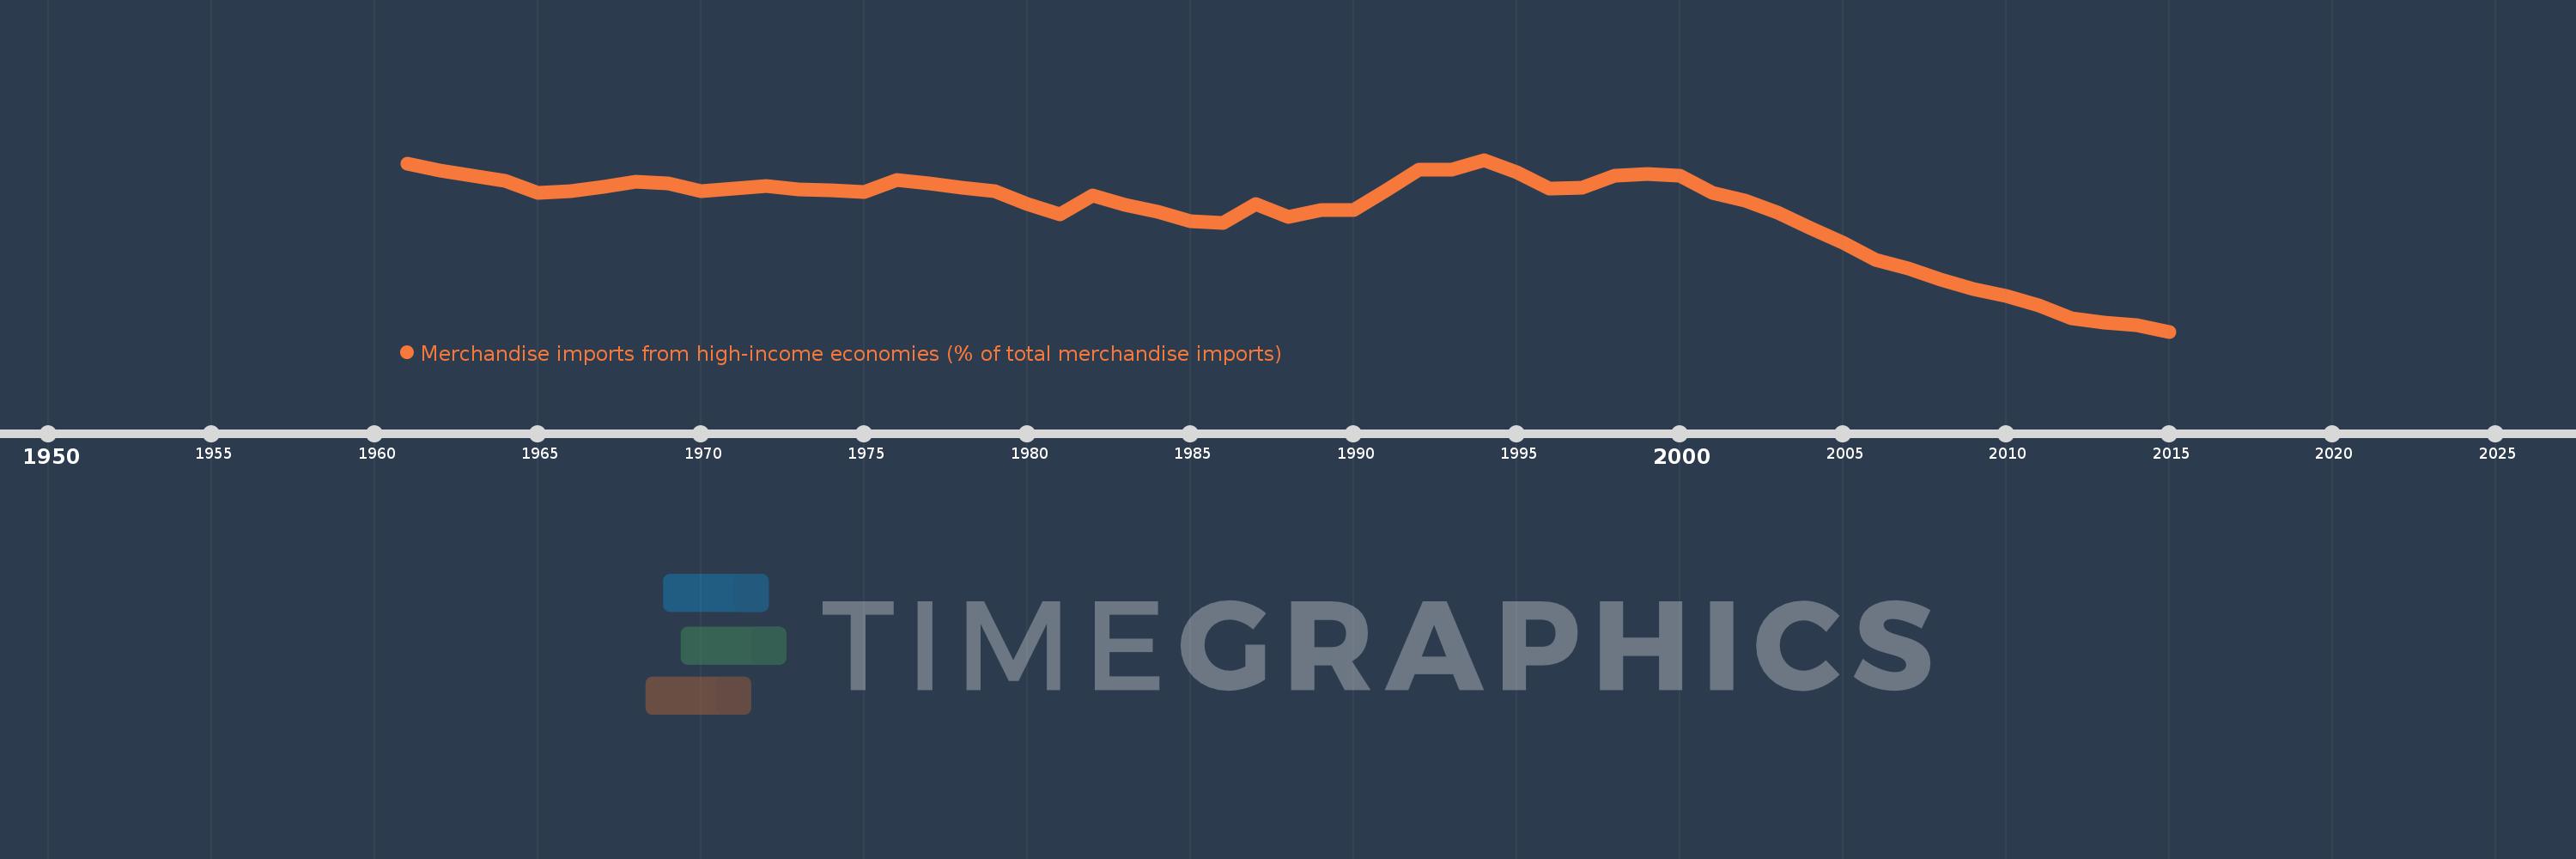
Merchandise imports from high-income economies (% of total merchandise imports)
2015,2014,2013,2012,2011,2010,2009,2008,2007,2006,2005,2004,2003,2002,2001,2000,1999,1998,1997,1996,1995,1994,1993,1992,1991,1990,1989,1988,1987,1986,1985,1984,1983,1982,1981,1980,1979,1978,1977,1976,1975,1974,1973,1972,1971,1970,1969,1968,1967,1966,1965,1964,1963,1962,1961
Estas estatísticas em outros países:
AfghanistanAlbaniaAlgeriaAngolaAntigua and BarbudaArab WorldArgentinaArmeniaArubaAustraliaAustriaAzerbaijanBahamas, TheBahrainBangladeshBarbadosBelarusBelgiumBelizeBeninBermudaBoliviaBosnia and HerzegovinaBrazilBrunei DarussalamBulgariaBurkina FasoBurundiCabo VerdeCambodiaCameroonCanadaCaribbean small statesCentral African RepublicCentral Europe and the BalticsChadChileChinaColombiaComorosCongo, Dem. Rep.Congo, Rep.Costa RicaCote d'IvoireCroatiaCubaCyprusCzech RepublicDenmarkDjiboutiDominicaDominican RepublicEarly-demographic dividendEast Asia & PacificEast Asia & Pacific (excluding high income)East Asia & Pacific (IDA & IBRD countries)EcuadorEgypt, Arab Rep.El SalvadorEquatorial GuineaEstoniaEthiopiaEuro areaEurope & Central AsiaEurope & Central Asia (excluding high income)Europe & Central Asia (IDA & IBRD countries)European UnionFaroe IslandsFijiFinlandFragile and conflict affected situationsFranceFrench PolynesiaGabonGambia, TheGeorgiaGermanyGhanaGibraltarGreeceGreenlandGrenadaGuamGuatemalaGuineaGuinea-BissauGuyanaHaitiHeavily indebted poor countries (HIPC)High incomeHondurasHong Kong SAR, ChinaHungaryIBRD onlyIcelandIDA & IBRD totalIDA blendIDA onlyIDA totalIndiaIndonesiaIran, Islamic Rep.IraqIrelandIsraelItalyJamaicaJapanJordanKazakhstanKenyaKiribatiKorea, Dem. People’s Rep.Korea, Rep.KosovoKuwaitKyrgyz RepublicLao PDRLate-demographic dividendLatin America & Caribbean Latin America & Caribbean (excluding high income)Latin America & the Caribbean (IDA & IBRD countries)LatviaLeast developed countries: UN classificationLebanonLiberiaLibyaLithuaniaLow & middle incomeLow incomeLower middle incomeLuxembourgMacao SAR, ChinaMacedonia, FYRMadagascarMalawiMalaysiaMaldivesMaliMaltaMauritaniaMauritiusMexicoMiddle East & North AfricaMiddle East & North Africa (excluding high income)Middle East & North Africa (IDA & IBRD countries)Middle incomeMoldovaMongoliaMontenegroMoroccoMozambiqueMyanmarNauruNepalNetherlandsNew CaledoniaNew ZealandNicaraguaNigerNigeriaNorth AmericaNorwayOECD membersOmanOther small statesPacific island small statesPakistanPanamaPapua New GuineaParaguayPeruPhilippinesPolandPortugalPost-demographic dividendPre-demographic dividendQatarRomaniaRussian FederationRwandaSamoaSao Tome and PrincipeSaudi ArabiaSenegalSerbiaSeychellesSierra LeoneSingaporeSlovak RepublicSloveniaSmall statesSolomon IslandsSomaliaSouth AfricaSouth AsiaSouth Asia (IDA & IBRD)SpainSri LankaSt. Kitts and NevisSt. LuciaSt. Vincent and the GrenadinesSub-Saharan Africa Sub-Saharan Africa (excluding high income)Sub-Saharan Africa (IDA & IBRD countries)SudanSurinameSwedenSwitzerlandSyrian Arab RepublicTajikistanTanzaniaThailandTogoTongaTrinidad and TobagoTunisiaTurkeyTurkmenistanTuvaluUgandaUkraineUnited Arab EmiratesUnited KingdomUnited StatesUpper middle incomeUruguayUzbekistanVanuatuVenezuela, RBVietnamWorldYemen, Rep.ZambiaZimbabwe Linha do tempo:
Nesta escala de tempo está apresentado um gráfico de 1961 ano até 2015 ano Middle income. Dados de 1960 ano ausente. O número de observações reais por data: 55.
Fonte (nome):
Indicadores de desenvolvimento mundial
Fonte (organização):
World Bank staff estimates based data from International Monetary Fund's Direction of Trade database.
Categorias:
Private Sector, Trade
Foi atualizado:
23 abr 2017 ano
Indicadores de alterações dos valores ao longo dos anos
Mínimo:
61.796
1 jan 2015 ano
Máximo:
82.52
1 jan 1994 ano
Na data de observação
Valor
Mudança absoluta
A alteração em relação ao valor anterior
1 jan 1961 ano
82.022
+82.022
0.0%
1 jan 1962 ano
81.251
-0.771
-0.94%
1 jan 1963 ano
80.618
-0.632
-0.78%
1 jan 1964 ano
79.974
-0.645
-0.8%
1 jan 1965 ano
78.571
-1.403
-1.75%
1 jan 1966 ano
78.704
+0.133
0.17%
1 jan 1967 ano
79.299
+0.595
0.76%
1 jan 1968 ano
79.922
+0.622
0.78%
1 jan 1969 ano
79.648
-0.274
-0.34%
1 jan 1970 ano
78.752
-0.896
-1.13%
1 jan 1971 ano
79.039
+0.287
0.36%
1 jan 1972 ano
79.384
+0.345
0.44%
1 jan 1973 ano
78.924
-0.46
-0.58%
1 jan 1974 ano
78.853
-0.071
-0.09%
1 jan 1975 ano
78.635
-0.218
-0.28%
1 jan 1976 ano
80.111
+1.476
1.88%
1 jan 1977 ano
79.673
-0.438
-0.55%
1 jan 1978 ano
79.163
-0.51
-0.64%
1 jan 1979 ano
78.699
-0.464
-0.59%
1 jan 1980 ano
77.223
-1.477
-1.88%
1 jan 1981 ano
75.947
-1.275
-1.65%
1 jan 1982 ano
78.24
+2.292
3.02%
1 jan 1983 ano
77.129
-1.111
-1.42%
1 jan 1984 ano
76.296
-0.832
-1.08%
1 jan 1985 ano
75.085
-1.212
-1.59%
1 jan 1986 ano
74.856
-0.229
-0.3%
1 jan 1987 ano
77.147
+2.291
3.06%
1 jan 1988 ano
75.627
-1.52
-1.97%
1 jan 1989 ano
76.43
+0.803
1.06%
1 jan 1990 ano
76.44
+0.011
0.01%
1 jan 1991 ano
78.818
+2.377
3.11%
1 jan 1992 ano
81.321
+2.503
3.18%
1 jan 1993 ano
81.367
+0.046
0.06%
1 jan 1994 ano
82.52
+1.153
1.42%
1 jan 1995 ano
81.059
-1.461
-1.77%
1 jan 1996 ano
79.0
-2.059
-2.54%
1 jan 1997 ano
79.176
+0.175
0.22%
1 jan 1998 ano
80.571
+1.395
1.76%
1 jan 1999 ano
80.814
+0.243
0.3%
1 jan 2000 ano
80.575
-0.239
-0.3%
1 jan 2001 ano
78.522
-2.053
-2.55%
1 jan 2002 ano
77.594
-0.928
-1.18%
1 jan 2003 ano
76.097
-1.497
-1.93%
1 jan 2004 ano
74.272
-1.825
-2.4%
1 jan 2005 ano
72.571
-1.7
-2.29%
1 jan 2006 ano
70.465
-2.106
-2.9%
1 jan 2007 ano
69.424
-1.041
-1.48%
1 jan 2008 ano
68.1
-1.324
-1.91%
1 jan 2009 ano
66.895
-1.205
-1.77%
1 jan 2010 ano
66.072
-0.823
-1.23%
1 jan 2011 ano
64.993
-1.079
-1.63%
1 jan 2012 ano
63.356
-1.637
-2.52%
1 jan 2013 ano
62.926
-0.43
-0.68%
1 jan 2014 ano
62.555
-0.371
-0.59%
1 jan 2015 ano
61.796
-0.76
-1.21%
Classificação de países por estatísticas atuais por anos


Comentários: