29
/pt/
pt
AIzaSyAYiBZKx7MnpbEhh9jyipgxe19OcubqV5w
April 1, 2024
96001
Burundi
BDI
true
2
1
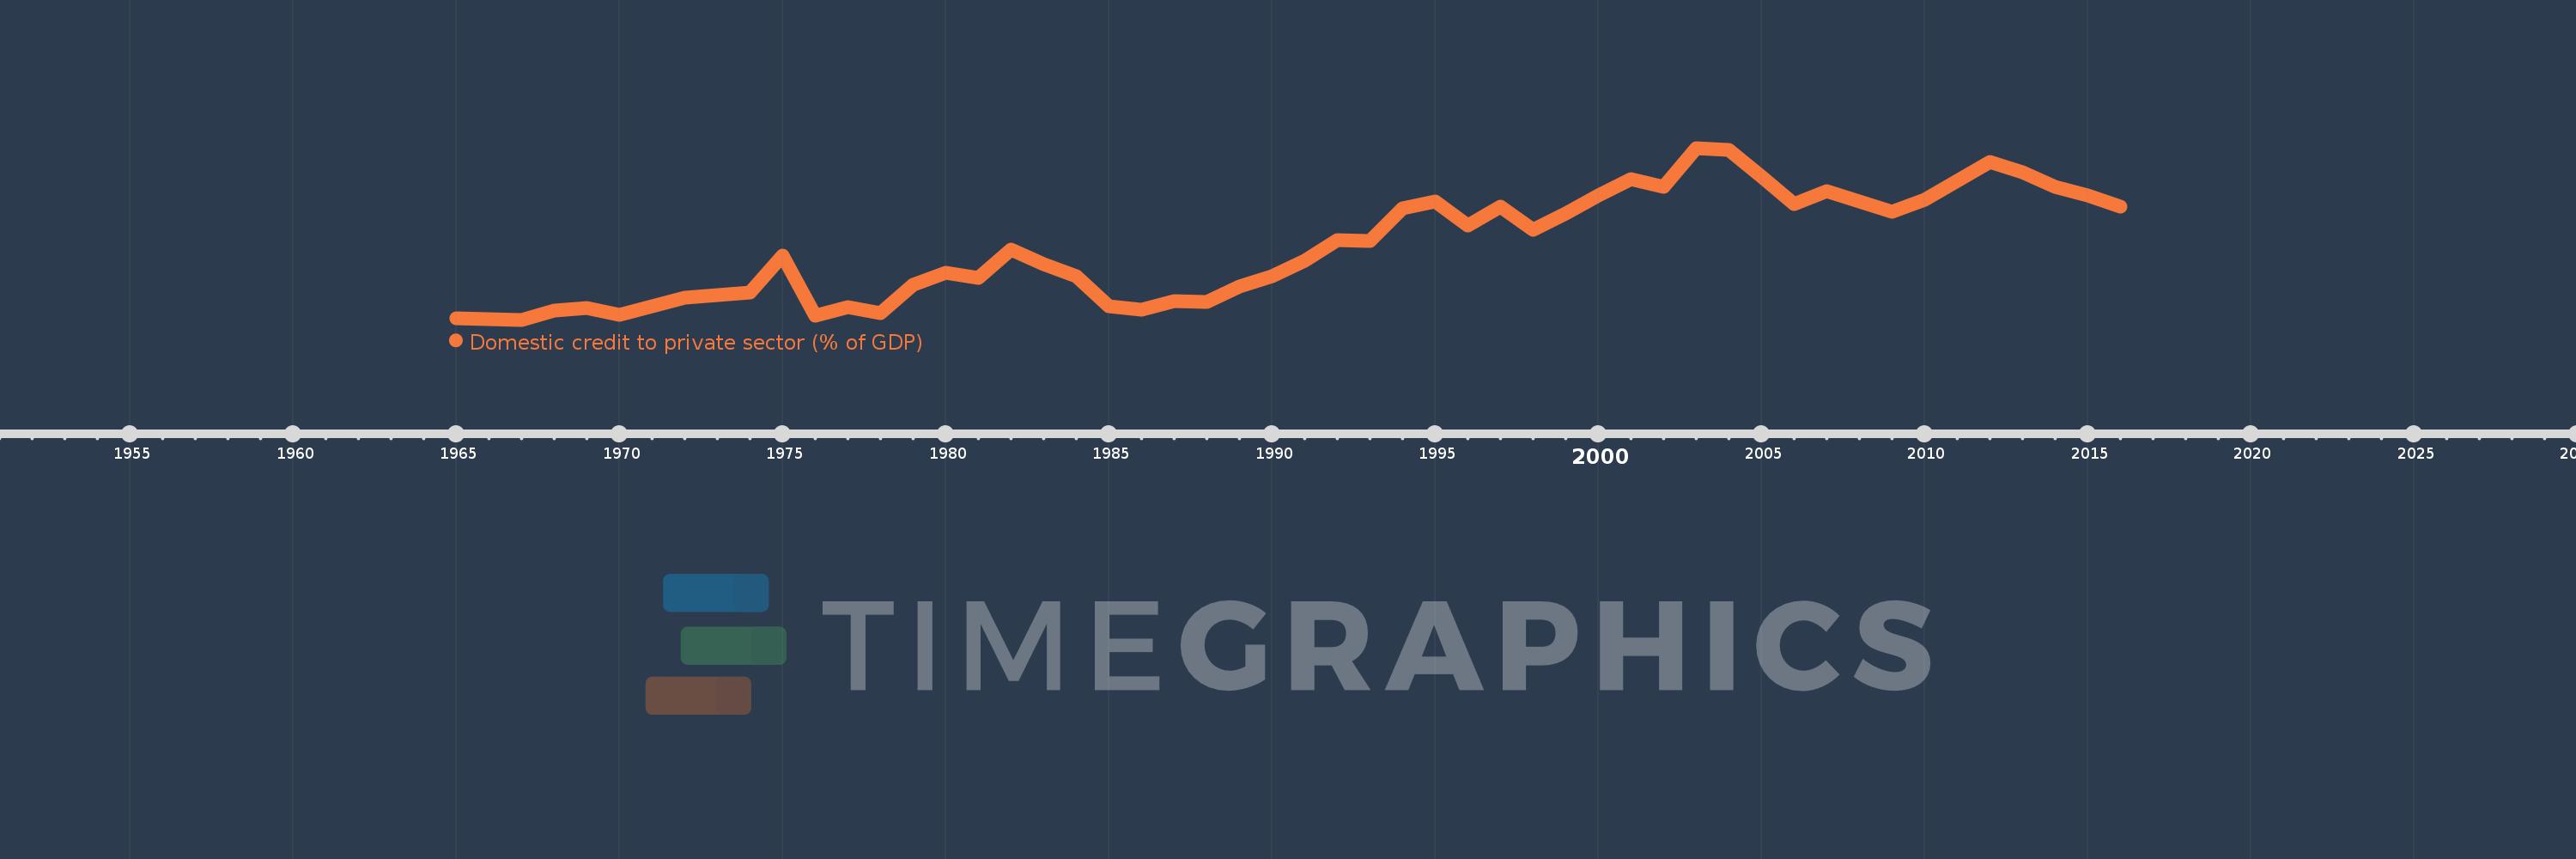
Domestic credit to private sector (% of GDP)
2016,2015,2014,2013,2012,2011,2010,2009,2008,2007,2006,2005,2004,2003,2002,2001,2000,1999,1998,1997,1996,1995,1994,1993,1992,1991,1990,1989,1988,1987,1986,1985,1984,1983,1982,1981,1980,1979,1978,1977,1976,1975,1974,1973,1972,1971,1970,1969,1968,1967,1966,1965
Estas estatísticas em outros países:
AfghanistanAlbaniaAlgeriaAngolaAntigua and BarbudaArab WorldArgentinaArmeniaArubaAustraliaAustriaAzerbaijanBahamas, TheBahrainBangladeshBarbadosBelarusBelgiumBelizeBeninBhutanBoliviaBosnia and HerzegovinaBotswanaBrazilBrunei DarussalamBulgariaBurkina FasoBurundiCabo VerdeCambodiaCameroonCanadaCaribbean small statesCentral African RepublicCentral Europe and the BalticsChadChileChinaColombiaComorosCongo, Dem. Rep.Congo, Rep.Costa RicaCote d'IvoireCroatiaCyprusCzech RepublicDenmarkDjiboutiDominicaDominican RepublicEarly-demographic dividendEast Asia & PacificEast Asia & Pacific (excluding high income)East Asia & Pacific (IDA & IBRD countries)EcuadorEgypt, Arab Rep.El SalvadorEquatorial GuineaEritreaEstoniaEthiopiaEuro areaEurope & Central AsiaEurope & Central Asia (excluding high income)Europe & Central Asia (IDA & IBRD countries)European UnionFijiFinlandFragile and conflict affected situationsFranceGabonGambia, TheGeorgiaGermanyGhanaGreeceGrenadaGuatemalaGuineaGuinea-BissauGuyanaHaitiHeavily indebted poor countries (HIPC)High incomeHondurasHong Kong SAR, ChinaHungaryIBRD onlyIcelandIDA & IBRD totalIDA blendIDA onlyIDA totalIndiaIndonesiaIran, Islamic Rep.IraqIrelandIsraelItalyJamaicaJapanJordanKazakhstanKenyaKorea, Rep.KosovoKuwaitKyrgyz RepublicLao PDRLate-demographic dividendLatin America & Caribbean Latin America & Caribbean (excluding high income)Latin America & the Caribbean (IDA & IBRD countries)LatviaLeast developed countries: UN classificationLebanonLesothoLiberiaLibyaLithuaniaLow & middle incomeLow incomeLower middle incomeLuxembourgMacao SAR, ChinaMacedonia, FYRMadagascarMalawiMalaysiaMaldivesMaliMaltaMauritaniaMauritiusMexicoMicronesia, Fed. Sts.Middle East & North AfricaMiddle East & North Africa (excluding high income)Middle East & North Africa (IDA & IBRD countries)Middle incomeMoldovaMongoliaMontenegroMoroccoMozambiqueMyanmarNamibiaNepalNetherlandsNew ZealandNicaraguaNigerNigeriaNorth AmericaNorwayOECD membersOmanOther small statesPacific island small statesPakistanPanamaPapua New GuineaParaguayPeruPhilippinesPolandPortugalPost-demographic dividendPre-demographic dividendQatarRomaniaRussian FederationRwandaSamoaSao Tome and PrincipeSaudi ArabiaSenegalSerbiaSeychellesSierra LeoneSingaporeSlovak RepublicSloveniaSmall statesSolomon IslandsSouth AfricaSouth AsiaSouth Asia (IDA & IBRD)South SudanSpainSri LankaSt. Kitts and NevisSt. LuciaSt. Vincent and the GrenadinesSub-Saharan Africa Sub-Saharan Africa (excluding high income)Sub-Saharan Africa (IDA & IBRD countries)SudanSurinameSwazilandSwedenSwitzerlandSyrian Arab RepublicTajikistanTanzaniaThailandTimor-LesteTogoTongaTrinidad and TobagoTunisiaTurkeyUgandaUkraineUnited Arab EmiratesUnited KingdomUnited StatesUpper middle incomeUruguayVanuatuVenezuela, RBVietnamWest Bank and GazaWorldYemen, Rep.ZambiaZimbabwe Linha do tempo:
Nesta escala de tempo está apresentado um gráfico de 1965 ano até 2016 ano Burundi. Dados de 1964 ano ausente. O número de observações reais por data: 52.
Fonte (nome):
Indicadores de desenvolvimento mundial
Fonte (organização):
International Monetary Fund, International Financial Statistics and data files, and World Bank and OECD GDP estimates.
Categorias:
Financial Sector, Private Sector
Foi atualizado:
23 abr 2017 ano
Indicadores de alterações dos valores ao longo dos anos
Mínimo:
2.542
1 jan 1967 ano
Máximo:
20.31
1 jan 2003 ano
Na data de observação
Valor
Mudança absoluta
A alteração em relação ao valor anterior
1 jan 1965 ano
2.669
+2.669
0.0%
1 jan 1966 ano
2.594
-0.075
-2.82%
1 jan 1967 ano
2.542
-0.052
-2.0%
1 jan 1968 ano
3.523
+0.981
38.61%
1 jan 1969 ano
3.795
+0.272
7.72%
1 jan 1970 ano
3.073
-0.723
-19.04%
1 jan 1971 ano
3.965
+0.893
29.05%
1 jan 1972 ano
4.856
+0.891
22.46%
1 jan 1973 ano
5.053
+0.198
4.07%
1 jan 1974 ano
5.331
+0.277
5.49%
1 jan 1975 ano
9.198
+3.867
72.54%
1 jan 1976 ano
2.932
-6.266
-68.12%
1 jan 1977 ano
3.846
+0.914
31.18%
1 jan 1978 ano
3.22
-0.626
-16.27%
1 jan 1979 ano
6.193
+2.973
92.3%
1 jan 1980 ano
7.415
+1.222
19.73%
1 jan 1981 ano
6.889
-0.526
-7.1%
1 jan 1982 ano
9.775
+2.886
41.9%
1 jan 1983 ano
8.261
-1.514
-15.49%
1 jan 1984 ano
7.027
-1.234
-14.93%
1 jan 1985 ano
3.971
-3.056
-43.49%
1 jan 1986 ano
3.573
-0.398
-10.02%
1 jan 1987 ano
4.455
+0.881
24.67%
1 jan 1988 ano
4.342
-0.113
-2.54%
1 jan 1989 ano
5.956
+1.615
37.19%
1 jan 1990 ano
7.005
+1.049
17.61%
1 jan 1991 ano
8.615
+1.609
22.97%
1 jan 1992 ano
10.748
+2.134
24.77%
1 jan 1993 ano
10.721
-0.027
-0.26%
1 jan 1994 ano
14.031
+3.31
30.88%
1 jan 1995 ano
14.736
+0.705
5.02%
1 jan 1996 ano
12.266
-2.47
-16.76%
1 jan 1997 ano
14.233
+1.968
16.04%
1 jan 1998 ano
11.872
-2.362
-16.59%
1 jan 1999 ano
13.535
+1.664
14.01%
1 jan 2000 ano
15.39
+1.855
13.7%
1 jan 2001 ano
17.08
+1.69
10.98%
1 jan 2002 ano
16.303
-0.777
-4.55%
1 jan 2003 ano
20.31
+4.007
24.58%
1 jan 2004 ano
20.133
-0.178
-0.87%
1 jan 2005 ano
17.351
-2.782
-13.82%
1 jan 2006 ano
14.542
-2.809
-16.19%
1 jan 2007 ano
15.833
+1.292
8.88%
1 jan 2008 ano
14.776
-1.057
-6.68%
1 jan 2009 ano
13.665
-1.111
-7.52%
1 jan 2010 ano
14.981
+1.316
9.63%
1 jan 2011 ano
16.871
+1.891
12.62%
1 jan 2012 ano
18.886
+2.014
11.94%
1 jan 2013 ano
17.81
-1.076
-5.7%
1 jan 2014 ano
16.267
-1.543
-8.66%
1 jan 2015 ano
15.36
-0.907
-5.58%
1 jan 2016 ano
14.257
-1.103
-7.18%
Classificação de países por estatísticas atuais por anos


Comentários: