29
/pt/
pt
AIzaSyAYiBZKx7MnpbEhh9jyipgxe19OcubqV5w
April 1, 2024
85798
Bhutan
BTN
true
2
1
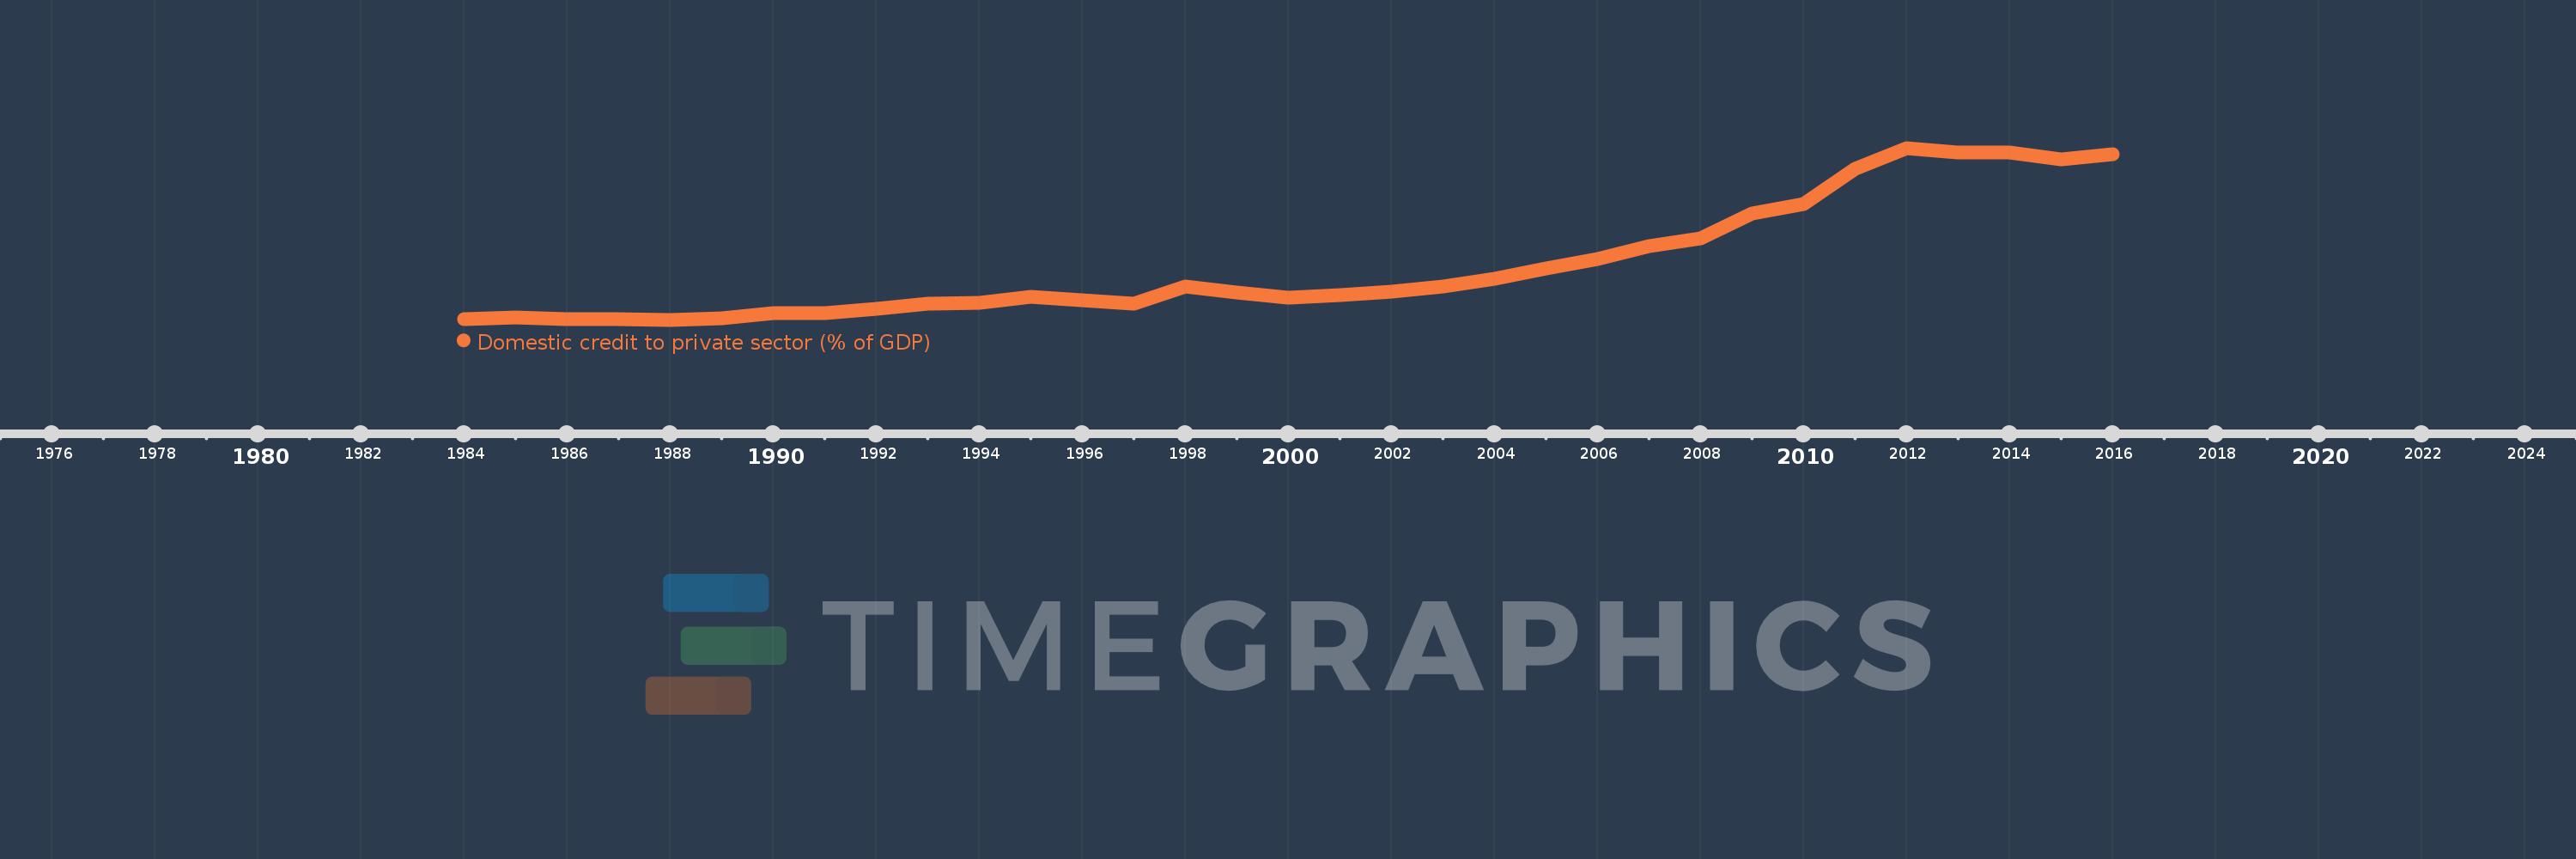
Domestic credit to private sector (% of GDP)
2016,2015,2014,2013,2012,2011,2010,2009,2008,2007,2006,2005,2004,2003,2002,2001,2000,1999,1998,1997,1996,1995,1994,1993,1992,1991,1990,1989,1988,1987,1986,1985,1984
Estas estatísticas em outros países:
AfghanistanAlbaniaAlgeriaAngolaAntigua and BarbudaArab WorldArgentinaArmeniaArubaAustraliaAustriaAzerbaijanBahamas, TheBahrainBangladeshBarbadosBelarusBelgiumBelizeBeninBhutanBoliviaBosnia and HerzegovinaBotswanaBrazilBrunei DarussalamBulgariaBurkina FasoBurundiCabo VerdeCambodiaCameroonCanadaCaribbean small statesCentral African RepublicCentral Europe and the BalticsChadChileChinaColombiaComorosCongo, Dem. Rep.Congo, Rep.Costa RicaCote d'IvoireCroatiaCyprusCzech RepublicDenmarkDjiboutiDominicaDominican RepublicEarly-demographic dividendEast Asia & PacificEast Asia & Pacific (excluding high income)East Asia & Pacific (IDA & IBRD countries)EcuadorEgypt, Arab Rep.El SalvadorEquatorial GuineaEritreaEstoniaEthiopiaEuro areaEurope & Central AsiaEurope & Central Asia (excluding high income)Europe & Central Asia (IDA & IBRD countries)European UnionFijiFinlandFragile and conflict affected situationsFranceGabonGambia, TheGeorgiaGermanyGhanaGreeceGrenadaGuatemalaGuineaGuinea-BissauGuyanaHaitiHeavily indebted poor countries (HIPC)High incomeHondurasHong Kong SAR, ChinaHungaryIBRD onlyIcelandIDA & IBRD totalIDA blendIDA onlyIDA totalIndiaIndonesiaIran, Islamic Rep.IraqIrelandIsraelItalyJamaicaJapanJordanKazakhstanKenyaKorea, Rep.KosovoKuwaitKyrgyz RepublicLao PDRLate-demographic dividendLatin America & Caribbean Latin America & Caribbean (excluding high income)Latin America & the Caribbean (IDA & IBRD countries)LatviaLeast developed countries: UN classificationLebanonLesothoLiberiaLibyaLithuaniaLow & middle incomeLow incomeLower middle incomeLuxembourgMacao SAR, ChinaMacedonia, FYRMadagascarMalawiMalaysiaMaldivesMaliMaltaMauritaniaMauritiusMexicoMicronesia, Fed. Sts.Middle East & North AfricaMiddle East & North Africa (excluding high income)Middle East & North Africa (IDA & IBRD countries)Middle incomeMoldovaMongoliaMontenegroMoroccoMozambiqueMyanmarNamibiaNepalNetherlandsNew ZealandNicaraguaNigerNigeriaNorth AmericaNorwayOECD membersOmanOther small statesPacific island small statesPakistanPanamaPapua New GuineaParaguayPeruPhilippinesPolandPortugalPost-demographic dividendPre-demographic dividendQatarRomaniaRussian FederationRwandaSamoaSao Tome and PrincipeSaudi ArabiaSenegalSerbiaSeychellesSierra LeoneSingaporeSlovak RepublicSloveniaSmall statesSolomon IslandsSouth AfricaSouth AsiaSouth Asia (IDA & IBRD)South SudanSpainSri LankaSt. Kitts and NevisSt. LuciaSt. Vincent and the GrenadinesSub-Saharan Africa Sub-Saharan Africa (excluding high income)Sub-Saharan Africa (IDA & IBRD countries)SudanSurinameSwazilandSwedenSwitzerlandSyrian Arab RepublicTajikistanTanzaniaThailandTimor-LesteTogoTongaTrinidad and TobagoTunisiaTurkeyUgandaUkraineUnited Arab EmiratesUnited KingdomUnited StatesUpper middle incomeUruguayVanuatuVenezuela, RBVietnamWest Bank and GazaWorldYemen, Rep.ZambiaZimbabwe Linha do tempo:
Nesta escala de tempo está apresentado um gráfico de 1984 ano até 2016 ano Bhutan. Dados de 1983 ano ausente. O número de observações reais por data: 33.
Fonte (nome):
Indicadores de desenvolvimento mundial
Fonte (organização):
International Monetary Fund, International Financial Statistics and data files, and World Bank and OECD GDP estimates.
Categorias:
Financial Sector, Private Sector
Foi atualizado:
23 abr 2017 ano
Indicadores de alterações dos valores ao longo dos anos
Mínimo:
2.508
1 jan 1988 ano
Máximo:
46.812
1 jan 2012 ano
Na data de observação
Valor
Mudança absoluta
A alteração em relação ao valor anterior
1 jan 1984 ano
2.577
+2.577
0.0%
1 jan 1985 ano
3.006
+0.429
16.64%
1 jan 1986 ano
2.601
-0.405
-13.49%
1 jan 1987 ano
2.65
+0.05
1.91%
1 jan 1988 ano
2.508
-0.142
-5.36%
1 jan 1989 ano
2.933
+0.425
16.95%
1 jan 1990 ano
4.291
+1.358
46.3%
1 jan 1991 ano
4.113
-0.179
-4.16%
1 jan 1992 ano
5.383
+1.27
30.89%
1 jan 1993 ano
6.549
+1.165
21.65%
1 jan 1994 ano
6.815
+0.266
4.07%
1 jan 1995 ano
8.521
+1.706
25.04%
1 jan 1996 ano
7.638
-0.883
-10.36%
1 jan 1997 ano
6.675
-0.963
-12.61%
1 jan 1998 ano
11.081
+4.405
66.0%
1 jan 1999 ano
9.466
-1.614
-14.57%
1 jan 2000 ano
8.258
-1.208
-12.76%
1 jan 2001 ano
8.854
+0.596
7.22%
1 jan 2002 ano
9.782
+0.927
10.47%
1 jan 2003 ano
11.109
+1.327
13.57%
1 jan 2004 ano
12.984
+1.875
16.88%
1 jan 2005 ano
15.815
+2.831
21.8%
1 jan 2006 ano
18.07
+2.255
14.26%
1 jan 2007 ano
21.41
+3.34
18.48%
1 jan 2008 ano
23.421
+2.011
9.39%
1 jan 2009 ano
29.961
+6.541
27.93%
1 jan 2010 ano
32.423
+2.461
8.21%
1 jan 2011 ano
41.452
+9.03
27.85%
1 jan 2012 ano
46.812
+5.359
12.93%
1 jan 2013 ano
45.718
-1.094
-2.34%
1 jan 2014 ano
45.638
-0.08
-0.18%
1 jan 2015 ano
43.817
-1.82
-3.99%
1 jan 2016 ano
45.213
+1.396
3.18%
Classificação de países por estatísticas atuais por anos


Comentários: