29
/pt/
pt
AIzaSyAYiBZKx7MnpbEhh9jyipgxe19OcubqV5w
April 1, 2024
113466
Cote d'Ivoire
CIV
true
2
1
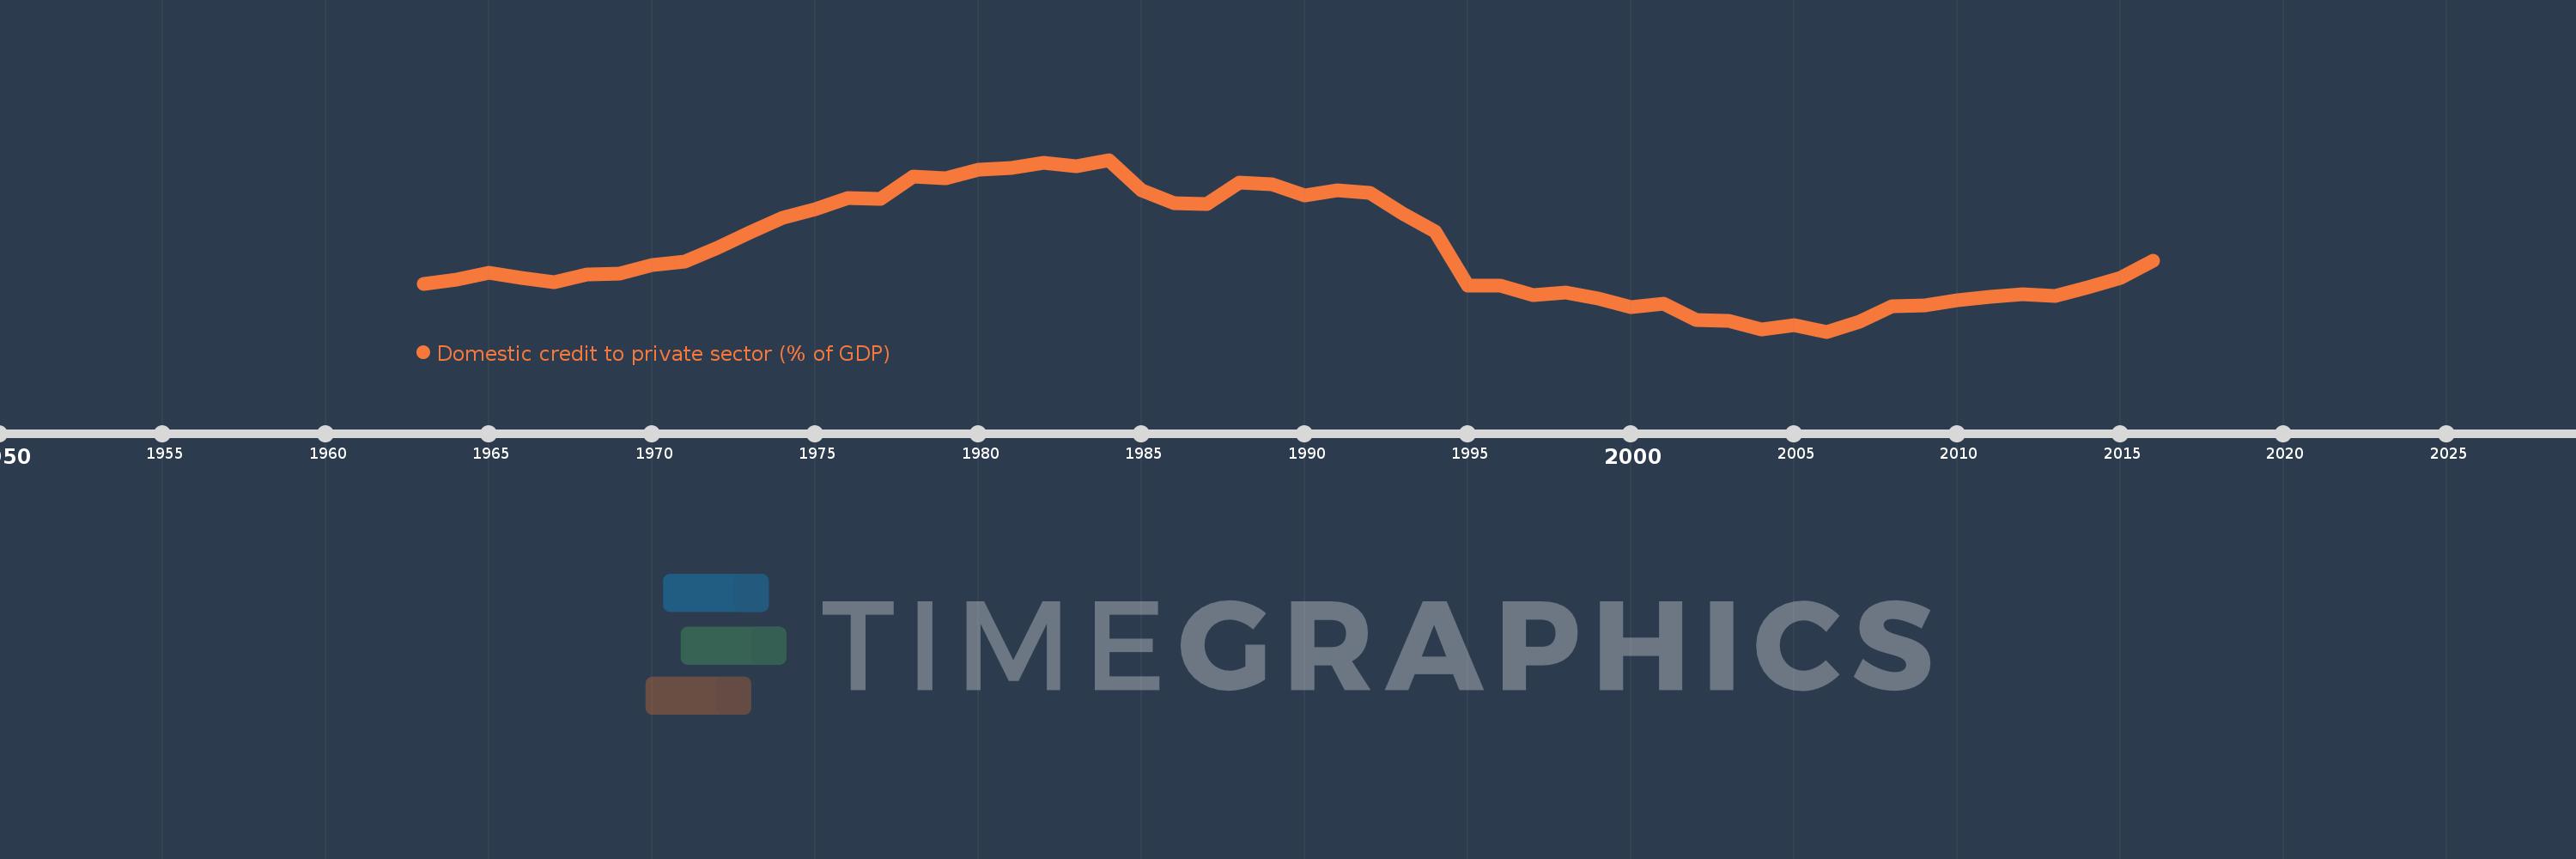
Domestic credit to private sector (% of GDP)
2016,2015,2014,2013,2012,2011,2010,2009,2008,2007,2006,2005,2004,2003,2002,2001,2000,1999,1998,1997,1996,1995,1994,1993,1992,1991,1990,1989,1988,1987,1986,1985,1984,1983,1982,1981,1980,1979,1978,1977,1976,1975,1974,1973,1972,1971,1970,1969,1968,1967,1966,1965,1964,1963
Estas estatísticas em outros países:
AfghanistanAlbaniaAlgeriaAngolaAntigua and BarbudaArab WorldArgentinaArmeniaArubaAustraliaAustriaAzerbaijanBahamas, TheBahrainBangladeshBarbadosBelarusBelgiumBelizeBeninBhutanBoliviaBosnia and HerzegovinaBotswanaBrazilBrunei DarussalamBulgariaBurkina FasoBurundiCabo VerdeCambodiaCameroonCanadaCaribbean small statesCentral African RepublicCentral Europe and the BalticsChadChileChinaColombiaComorosCongo, Dem. Rep.Congo, Rep.Costa RicaCote d'IvoireCroatiaCyprusCzech RepublicDenmarkDjiboutiDominicaDominican RepublicEarly-demographic dividendEast Asia & PacificEast Asia & Pacific (excluding high income)East Asia & Pacific (IDA & IBRD countries)EcuadorEgypt, Arab Rep.El SalvadorEquatorial GuineaEritreaEstoniaEthiopiaEuro areaEurope & Central AsiaEurope & Central Asia (excluding high income)Europe & Central Asia (IDA & IBRD countries)European UnionFijiFinlandFragile and conflict affected situationsFranceGabonGambia, TheGeorgiaGermanyGhanaGreeceGrenadaGuatemalaGuineaGuinea-BissauGuyanaHaitiHeavily indebted poor countries (HIPC)High incomeHondurasHong Kong SAR, ChinaHungaryIBRD onlyIcelandIDA & IBRD totalIDA blendIDA onlyIDA totalIndiaIndonesiaIran, Islamic Rep.IraqIrelandIsraelItalyJamaicaJapanJordanKazakhstanKenyaKorea, Rep.KosovoKuwaitKyrgyz RepublicLao PDRLate-demographic dividendLatin America & Caribbean Latin America & Caribbean (excluding high income)Latin America & the Caribbean (IDA & IBRD countries)LatviaLeast developed countries: UN classificationLebanonLesothoLiberiaLibyaLithuaniaLow & middle incomeLow incomeLower middle incomeLuxembourgMacao SAR, ChinaMacedonia, FYRMadagascarMalawiMalaysiaMaldivesMaliMaltaMauritaniaMauritiusMexicoMicronesia, Fed. Sts.Middle East & North AfricaMiddle East & North Africa (excluding high income)Middle East & North Africa (IDA & IBRD countries)Middle incomeMoldovaMongoliaMontenegroMoroccoMozambiqueMyanmarNamibiaNepalNetherlandsNew ZealandNicaraguaNigerNigeriaNorth AmericaNorwayOECD membersOmanOther small statesPacific island small statesPakistanPanamaPapua New GuineaParaguayPeruPhilippinesPolandPortugalPost-demographic dividendPre-demographic dividendQatarRomaniaRussian FederationRwandaSamoaSao Tome and PrincipeSaudi ArabiaSenegalSerbiaSeychellesSierra LeoneSingaporeSlovak RepublicSloveniaSmall statesSolomon IslandsSouth AfricaSouth AsiaSouth Asia (IDA & IBRD)South SudanSpainSri LankaSt. Kitts and NevisSt. LuciaSt. Vincent and the GrenadinesSub-Saharan Africa Sub-Saharan Africa (excluding high income)Sub-Saharan Africa (IDA & IBRD countries)SudanSurinameSwazilandSwedenSwitzerlandSyrian Arab RepublicTajikistanTanzaniaThailandTimor-LesteTogoTongaTrinidad and TobagoTunisiaTurkeyUgandaUkraineUnited Arab EmiratesUnited KingdomUnited StatesUpper middle incomeUruguayVanuatuVenezuela, RBVietnamWest Bank and GazaWorldYemen, Rep.ZambiaZimbabwe Linha do tempo:
Nesta escala de tempo está apresentado um gráfico de 1963 ano até 2016 ano Cote d'Ivoire. Dados de 1962 ano ausente. O número de observações reais por data: 54.
Fonte (nome):
Indicadores de desenvolvimento mundial
Fonte (organização):
International Monetary Fund, International Financial Statistics and data files, and World Bank and OECD GDP estimates.
Categorias:
Financial Sector, Private Sector
Foi atualizado:
23 abr 2017 ano
Indicadores de alterações dos valores ao longo dos anos
Mínimo:
9.76
1 jan 2006 ano
Máximo:
42.264
1 jan 1984 ano
Na data de observação
Valor
Mudança absoluta
A alteração em relação ao valor anterior
1 jan 1963 ano
18.709
+18.709
0.0%
1 jan 1964 ano
19.596
+0.887
4.74%
1 jan 1965 ano
20.972
+1.376
7.02%
1 jan 1966 ano
19.845
-1.127
-5.37%
1 jan 1967 ano
19.145
-0.699
-3.52%
1 jan 1968 ano
20.559
+1.414
7.38%
1 jan 1969 ano
20.653
+0.093
0.45%
1 jan 1970 ano
22.337
+1.684
8.16%
1 jan 1971 ano
23.038
+0.701
3.14%
1 jan 1972 ano
25.527
+2.49
10.81%
1 jan 1973 ano
28.515
+2.988
11.71%
1 jan 1974 ano
31.366
+2.851
10.0%
1 jan 1975 ano
32.982
+1.616
5.15%
1 jan 1976 ano
35.053
+2.071
6.28%
1 jan 1977 ano
34.917
-0.136
-0.39%
1 jan 1978 ano
39.056
+4.139
11.85%
1 jan 1979 ano
38.74
-0.316
-0.81%
1 jan 1980 ano
40.409
+1.669
4.31%
1 jan 1981 ano
40.762
+0.353
0.87%
1 jan 1982 ano
41.763
+1.001
2.46%
1 jan 1983 ano
41.112
-0.651
-1.56%
1 jan 1984 ano
42.264
+1.152
2.8%
1 jan 1985 ano
36.415
-5.849
-13.84%
1 jan 1986 ano
34.051
-2.364
-6.49%
1 jan 1987 ano
33.864
-0.187
-0.55%
1 jan 1988 ano
37.939
+4.075
12.03%
1 jan 1989 ano
37.658
-0.281
-0.74%
1 jan 1990 ano
35.548
-2.11
-5.6%
1 jan 1991 ano
36.495
+0.947
2.66%
1 jan 1992 ano
36.01
-0.485
-1.33%
1 jan 1993 ano
32.059
-3.951
-10.97%
1 jan 1994 ano
28.656
-3.404
-10.62%
1 jan 1995 ano
18.522
-10.134
-35.36%
1 jan 1996 ano
18.505
-0.017
-0.09%
1 jan 1997 ano
16.726
-1.779
-9.61%
1 jan 1998 ano
17.092
+0.366
2.19%
1 jan 1999 ano
15.949
-1.143
-6.69%
1 jan 2000 ano
14.442
-1.507
-9.45%
1 jan 2001 ano
15.063
+0.621
4.3%
1 jan 2002 ano
12.027
-3.036
-20.16%
1 jan 2003 ano
11.84
-0.186
-1.55%
1 jan 2004 ano
10.186
-1.654
-13.97%
1 jan 2005 ano
10.959
+0.773
7.59%
1 jan 2006 ano
9.76
-1.199
-10.94%
1 jan 2007 ano
11.634
+1.874
19.19%
1 jan 2008 ano
14.589
+2.955
25.4%
1 jan 2009 ano
14.773
+0.184
1.26%
1 jan 2010 ano
15.723
+0.949
6.43%
1 jan 2011 ano
16.39
+0.667
4.24%
1 jan 2012 ano
16.892
+0.503
3.07%
1 jan 2013 ano
16.465
-0.427
-2.53%
1 jan 2014 ano
18.067
+1.602
9.73%
1 jan 2015 ano
19.895
+1.828
10.12%
1 jan 2016 ano
23.091
+3.196
16.06%
Classificação de países por estatísticas atuais por anos


Comentários: