29
/pt/
pt
AIzaSyAYiBZKx7MnpbEhh9jyipgxe19OcubqV5w
April 1, 2024
177553
Lesotho
LSO
true
2
1
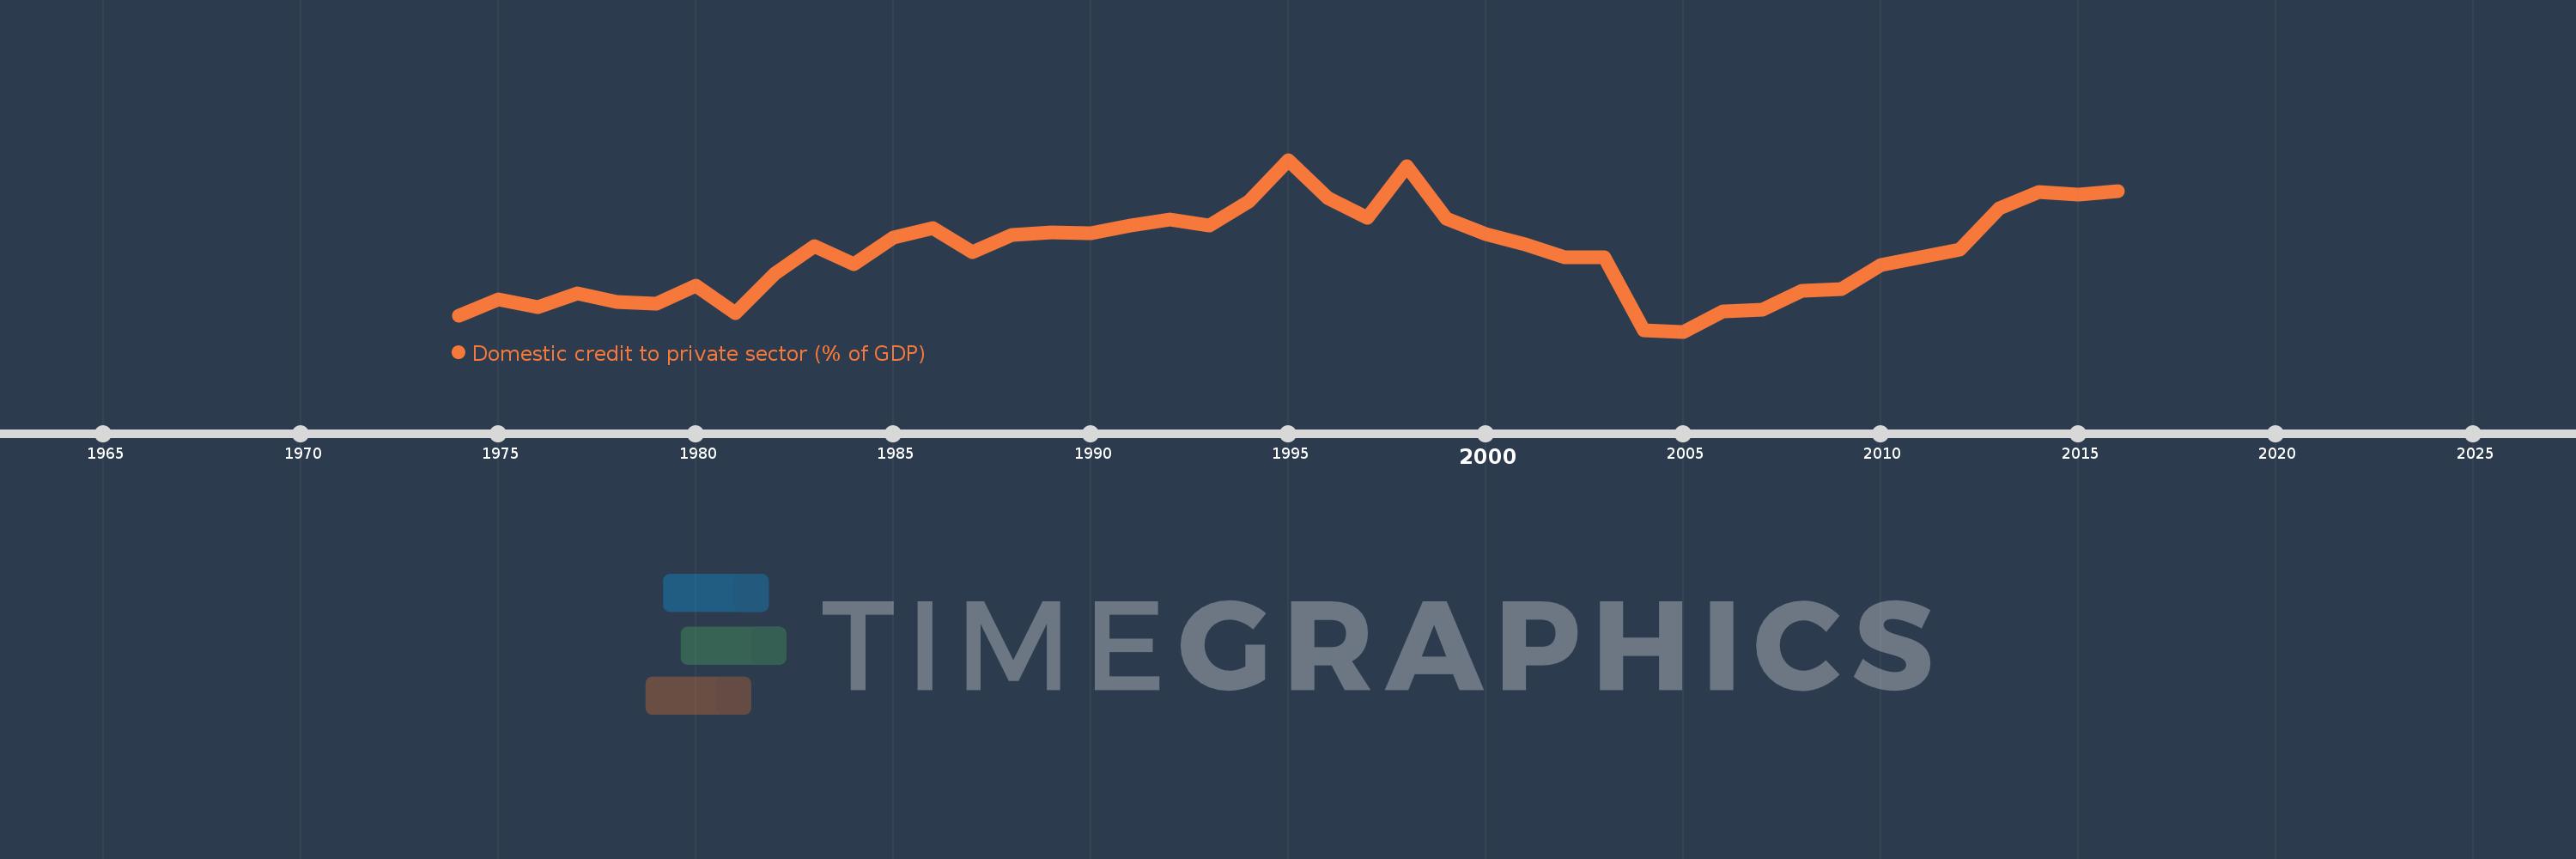
Domestic credit to private sector (% of GDP)
2016,2015,2014,2013,2012,2011,2010,2009,2008,2007,2006,2005,2004,2003,2002,2001,2000,1999,1998,1997,1996,1995,1994,1993,1992,1991,1990,1989,1988,1987,1986,1985,1984,1983,1982,1981,1980,1979,1978,1977,1976,1975,1974
Estas estatísticas em outros países:
AfghanistanAlbaniaAlgeriaAngolaAntigua and BarbudaArab WorldArgentinaArmeniaArubaAustraliaAustriaAzerbaijanBahamas, TheBahrainBangladeshBarbadosBelarusBelgiumBelizeBeninBhutanBoliviaBosnia and HerzegovinaBotswanaBrazilBrunei DarussalamBulgariaBurkina FasoBurundiCabo VerdeCambodiaCameroonCanadaCaribbean small statesCentral African RepublicCentral Europe and the BalticsChadChileChinaColombiaComorosCongo, Dem. Rep.Congo, Rep.Costa RicaCote d'IvoireCroatiaCyprusCzech RepublicDenmarkDjiboutiDominicaDominican RepublicEarly-demographic dividendEast Asia & PacificEast Asia & Pacific (excluding high income)East Asia & Pacific (IDA & IBRD countries)EcuadorEgypt, Arab Rep.El SalvadorEquatorial GuineaEritreaEstoniaEthiopiaEuro areaEurope & Central AsiaEurope & Central Asia (excluding high income)Europe & Central Asia (IDA & IBRD countries)European UnionFijiFinlandFragile and conflict affected situationsFranceGabonGambia, TheGeorgiaGermanyGhanaGreeceGrenadaGuatemalaGuineaGuinea-BissauGuyanaHaitiHeavily indebted poor countries (HIPC)High incomeHondurasHong Kong SAR, ChinaHungaryIBRD onlyIcelandIDA & IBRD totalIDA blendIDA onlyIDA totalIndiaIndonesiaIran, Islamic Rep.IraqIrelandIsraelItalyJamaicaJapanJordanKazakhstanKenyaKorea, Rep.KosovoKuwaitKyrgyz RepublicLao PDRLate-demographic dividendLatin America & Caribbean Latin America & Caribbean (excluding high income)Latin America & the Caribbean (IDA & IBRD countries)LatviaLeast developed countries: UN classificationLebanonLesothoLiberiaLibyaLithuaniaLow & middle incomeLow incomeLower middle incomeLuxembourgMacao SAR, ChinaMacedonia, FYRMadagascarMalawiMalaysiaMaldivesMaliMaltaMauritaniaMauritiusMexicoMicronesia, Fed. Sts.Middle East & North AfricaMiddle East & North Africa (excluding high income)Middle East & North Africa (IDA & IBRD countries)Middle incomeMoldovaMongoliaMontenegroMoroccoMozambiqueMyanmarNamibiaNepalNetherlandsNew ZealandNicaraguaNigerNigeriaNorth AmericaNorwayOECD membersOmanOther small statesPacific island small statesPakistanPanamaPapua New GuineaParaguayPeruPhilippinesPolandPortugalPost-demographic dividendPre-demographic dividendQatarRomaniaRussian FederationRwandaSamoaSao Tome and PrincipeSaudi ArabiaSenegalSerbiaSeychellesSierra LeoneSingaporeSlovak RepublicSloveniaSmall statesSolomon IslandsSouth AfricaSouth AsiaSouth Asia (IDA & IBRD)South SudanSpainSri LankaSt. Kitts and NevisSt. LuciaSt. Vincent and the GrenadinesSub-Saharan Africa Sub-Saharan Africa (excluding high income)Sub-Saharan Africa (IDA & IBRD countries)SudanSurinameSwazilandSwedenSwitzerlandSyrian Arab RepublicTajikistanTanzaniaThailandTimor-LesteTogoTongaTrinidad and TobagoTunisiaTurkeyUgandaUkraineUnited Arab EmiratesUnited KingdomUnited StatesUpper middle incomeUruguayVanuatuVenezuela, RBVietnamWest Bank and GazaWorldYemen, Rep.ZambiaZimbabwe Linha do tempo:
Nesta escala de tempo está apresentado um gráfico de 1974 ano até 2016 ano Lesotho. Dados de 1973 ano ausente. O número de observações reais por data: 43.
Fonte (nome):
Indicadores de desenvolvimento mundial
Fonte (organização):
International Monetary Fund, International Financial Statistics and data files, and World Bank and OECD GDP estimates.
Categorias:
Financial Sector, Private Sector
Foi atualizado:
23 abr 2017 ano
Indicadores de alterações dos valores ao longo dos anos
Mínimo:
5.256
1 jan 2005 ano
Máximo:
22.021
1 jan 1995 ano
Na data de observação
Valor
Mudança absoluta
A alteração em relação ao valor anterior
1 jan 1974 ano
6.826
+6.826
0.0%
1 jan 1975 ano
8.396
+1.57
22.99%
1 jan 1976 ano
7.626
-0.77
-9.18%
1 jan 1977 ano
9.01
+1.384
18.16%
1 jan 1978 ano
8.114
-0.896
-9.94%
1 jan 1979 ano
7.954
-0.16
-1.97%
1 jan 1980 ano
9.764
+1.81
22.75%
1 jan 1981 ano
7.058
-2.706
-27.72%
1 jan 1982 ano
10.902
+3.844
54.47%
1 jan 1983 ano
13.588
+2.686
24.64%
1 jan 1984 ano
11.799
-1.789
-13.17%
1 jan 1985 ano
14.469
+2.67
22.63%
1 jan 1986 ano
15.36
+0.891
6.15%
1 jan 1987 ano
12.976
-2.384
-15.52%
1 jan 1988 ano
14.727
+1.751
13.49%
1 jan 1989 ano
14.942
+0.215
1.46%
1 jan 1990 ano
14.85
-0.093
-0.62%
1 jan 1991 ano
15.596
+0.746
5.03%
1 jan 1992 ano
16.164
+0.568
3.64%
1 jan 1993 ano
15.594
-0.569
-3.52%
1 jan 1994 ano
17.979
+2.385
15.29%
1 jan 1995 ano
22.021
+4.042
22.48%
1 jan 1996 ano
18.251
-3.77
-17.12%
1 jan 1997 ano
16.344
-1.907
-10.45%
1 jan 1998 ano
21.37
+5.026
30.75%
1 jan 1999 ano
16.242
-5.129
-24.0%
1 jan 2000 ano
14.749
-1.493
-9.19%
1 jan 2001 ano
13.771
-0.978
-6.63%
1 jan 2002 ano
12.472
-1.3
-9.44%
1 jan 2003 ano
12.497
+0.025
0.2%
1 jan 2004 ano
5.35
-7.147
-57.19%
1 jan 2005 ano
5.256
-0.094
-1.75%
1 jan 2006 ano
7.233
+1.977
37.62%
1 jan 2007 ano
7.361
+0.128
1.77%
1 jan 2008 ano
9.208
+1.847
25.1%
1 jan 2009 ano
9.441
+0.233
2.53%
1 jan 2010 ano
11.737
+2.295
24.31%
1 jan 2011 ano
12.527
+0.79
6.73%
1 jan 2012 ano
13.237
+0.71
5.67%
1 jan 2013 ano
17.26
+4.023
30.4%
1 jan 2014 ano
18.88
+1.62
9.39%
1 jan 2015 ano
18.587
-0.293
-1.55%
1 jan 2016 ano
18.929
+0.342
1.84%
Classificação de países por estatísticas atuais por anos


Comentários: