29
/pt/
pt
AIzaSyAYiBZKx7MnpbEhh9jyipgxe19OcubqV5w
April 1, 2024
29758
Euro area
EMU
false
2
1
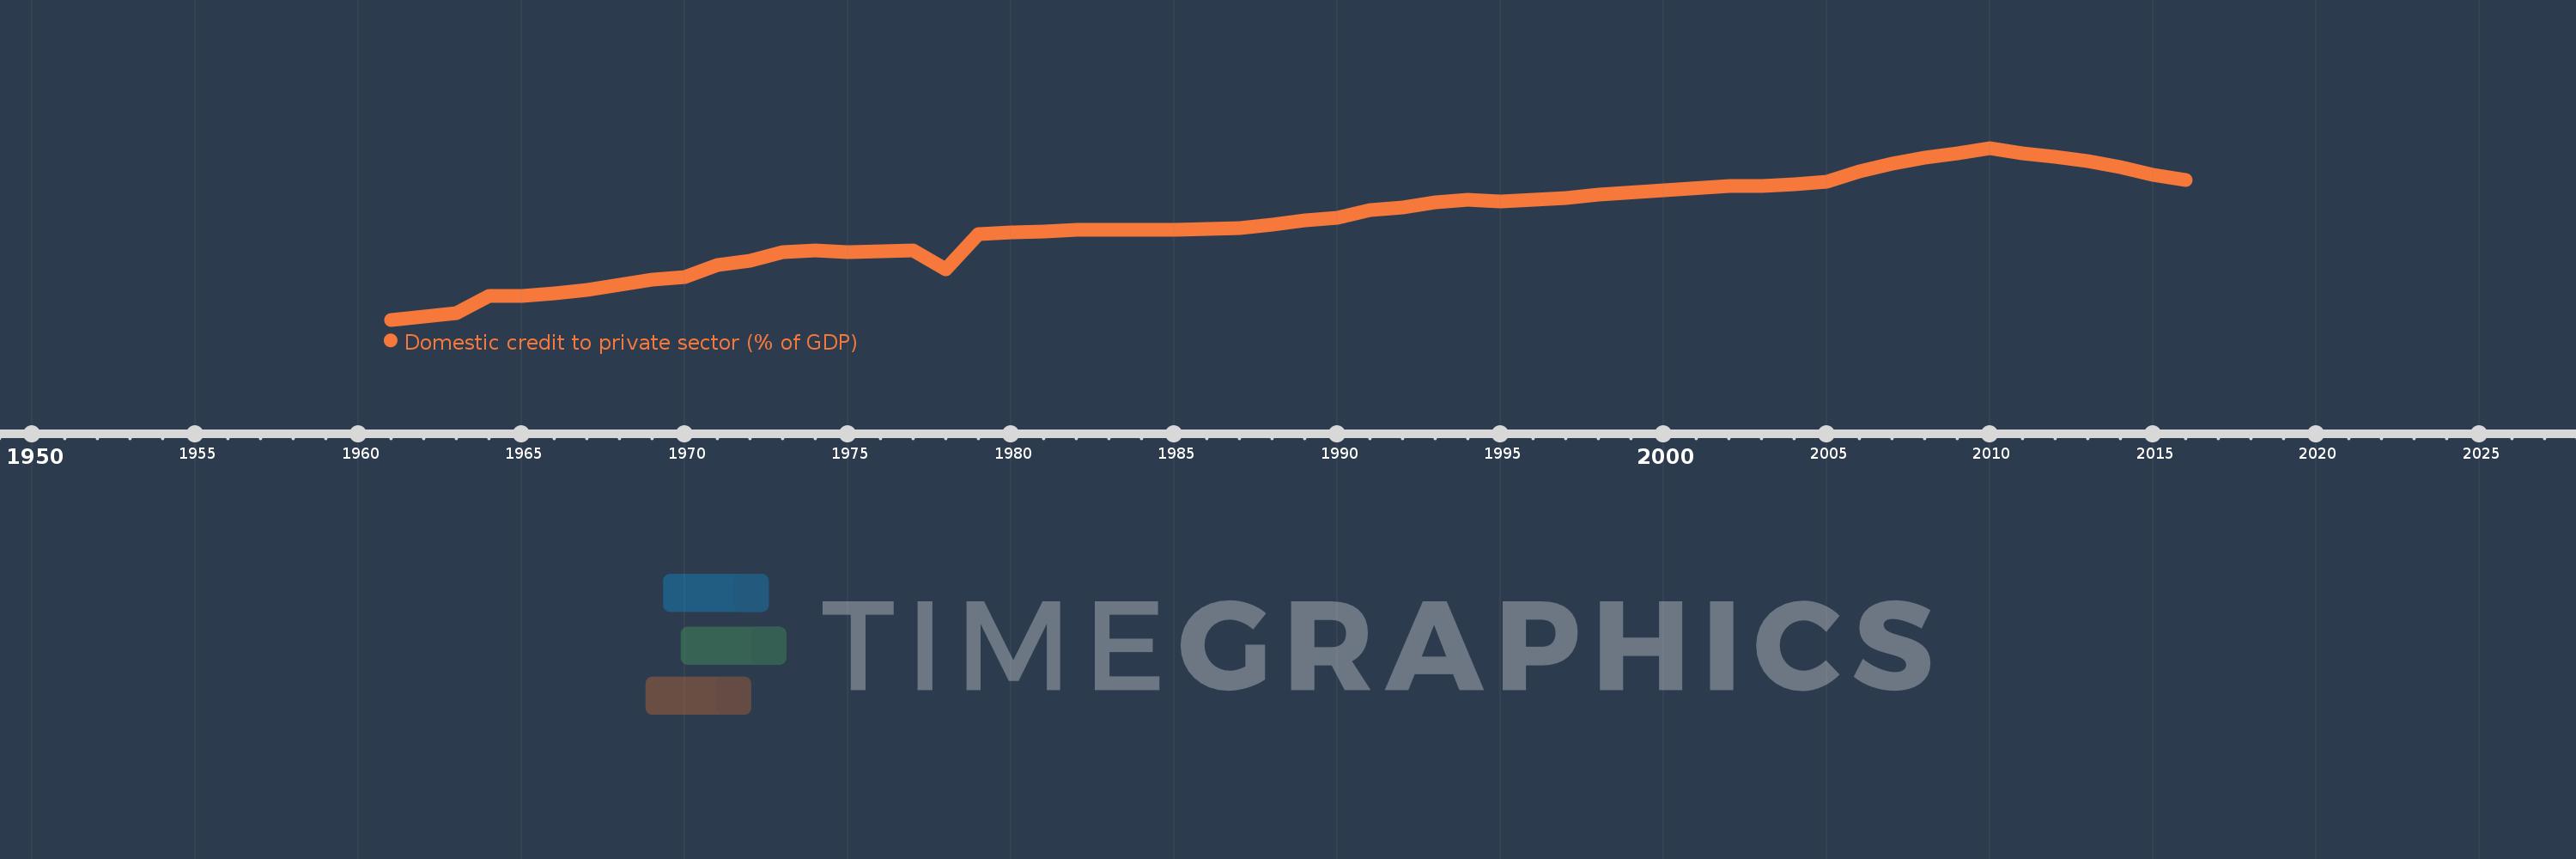
Domestic credit to private sector (% of GDP)
2016,2015,2014,2013,2012,2011,2010,2009,2008,2007,2006,2005,2004,2003,2002,1998,1997,1996,1995,1994,1993,1992,1991,1990,1989,1988,1987,1986,1985,1984,1983,1982,1981,1980,1979,1978,1977,1976,1975,1974,1973,1972,1971,1970,1969,1968,1967,1966,1965,1964,1963,1962,1961
Estas estatísticas em outros países:
AfghanistanAlbaniaAlgeriaAngolaAntigua and BarbudaArab WorldArgentinaArmeniaArubaAustraliaAustriaAzerbaijanBahamas, TheBahrainBangladeshBarbadosBelarusBelgiumBelizeBeninBhutanBoliviaBosnia and HerzegovinaBotswanaBrazilBrunei DarussalamBulgariaBurkina FasoBurundiCabo VerdeCambodiaCameroonCanadaCaribbean small statesCentral African RepublicCentral Europe and the BalticsChadChileChinaColombiaComorosCongo, Dem. Rep.Congo, Rep.Costa RicaCote d'IvoireCroatiaCyprusCzech RepublicDenmarkDjiboutiDominicaDominican RepublicEarly-demographic dividendEast Asia & PacificEast Asia & Pacific (excluding high income)East Asia & Pacific (IDA & IBRD countries)EcuadorEgypt, Arab Rep.El SalvadorEquatorial GuineaEritreaEstoniaEthiopiaEuro areaEurope & Central AsiaEurope & Central Asia (excluding high income)Europe & Central Asia (IDA & IBRD countries)European UnionFijiFinlandFragile and conflict affected situationsFranceGabonGambia, TheGeorgiaGermanyGhanaGreeceGrenadaGuatemalaGuineaGuinea-BissauGuyanaHaitiHeavily indebted poor countries (HIPC)High incomeHondurasHong Kong SAR, ChinaHungaryIBRD onlyIcelandIDA & IBRD totalIDA blendIDA onlyIDA totalIndiaIndonesiaIran, Islamic Rep.IraqIrelandIsraelItalyJamaicaJapanJordanKazakhstanKenyaKorea, Rep.KosovoKuwaitKyrgyz RepublicLao PDRLate-demographic dividendLatin America & Caribbean Latin America & Caribbean (excluding high income)Latin America & the Caribbean (IDA & IBRD countries)LatviaLeast developed countries: UN classificationLebanonLesothoLiberiaLibyaLithuaniaLow & middle incomeLow incomeLower middle incomeLuxembourgMacao SAR, ChinaMacedonia, FYRMadagascarMalawiMalaysiaMaldivesMaliMaltaMauritaniaMauritiusMexicoMicronesia, Fed. Sts.Middle East & North AfricaMiddle East & North Africa (excluding high income)Middle East & North Africa (IDA & IBRD countries)Middle incomeMoldovaMongoliaMontenegroMoroccoMozambiqueMyanmarNamibiaNepalNetherlandsNew ZealandNicaraguaNigerNigeriaNorth AmericaNorwayOECD membersOmanOther small statesPacific island small statesPakistanPanamaPapua New GuineaParaguayPeruPhilippinesPolandPortugalPost-demographic dividendPre-demographic dividendQatarRomaniaRussian FederationRwandaSamoaSao Tome and PrincipeSaudi ArabiaSenegalSerbiaSeychellesSierra LeoneSingaporeSlovak RepublicSloveniaSmall statesSolomon IslandsSouth AfricaSouth AsiaSouth Asia (IDA & IBRD)South SudanSpainSri LankaSt. Kitts and NevisSt. LuciaSt. Vincent and the GrenadinesSub-Saharan Africa Sub-Saharan Africa (excluding high income)Sub-Saharan Africa (IDA & IBRD countries)SudanSurinameSwazilandSwedenSwitzerlandSyrian Arab RepublicTajikistanTanzaniaThailandTimor-LesteTogoTongaTrinidad and TobagoTunisiaTurkeyUgandaUkraineUnited Arab EmiratesUnited KingdomUnited StatesUpper middle incomeUruguayVanuatuVenezuela, RBVietnamWest Bank and GazaWorldYemen, Rep.ZambiaZimbabwe Linha do tempo:
Nesta escala de tempo está apresentado um gráfico de 1961 ano até 2016 ano Euro area. Dados de 1960 ano ausente. O número de observações reais por data: 53.
Fonte (nome):
Indicadores de desenvolvimento mundial
Fonte (organização):
International Monetary Fund, International Financial Statistics and data files, and World Bank and OECD GDP estimates.
Categorias:
Financial Sector, Private Sector
Foi atualizado:
23 abr 2017 ano
Indicadores de alterações dos valores ao longo dos anos
Mínimo:
21.782
1 jan 1961 ano
Máximo:
106.15
1 jan 2010 ano
Na data de observação
Valor
Mudança absoluta
A alteração em relação ao valor anterior
1 jan 1961 ano
21.782
+21.782
0.0%
1 jan 1962 ano
23.329
+1.547
7.1%
1 jan 1963 ano
25.087
+1.758
7.54%
1 jan 1964 ano
33.447
+8.361
33.33%
1 jan 1965 ano
33.635
+0.188
0.56%
1 jan 1966 ano
34.836
+1.201
3.57%
1 jan 1967 ano
36.582
+1.746
5.01%
1 jan 1968 ano
38.878
+2.296
6.28%
1 jan 1969 ano
41.582
+2.704
6.96%
1 jan 1970 ano
42.957
+1.375
3.31%
1 jan 1971 ano
48.636
+5.679
13.22%
1 jan 1972 ano
50.944
+2.308
4.75%
1 jan 1973 ano
54.991
+4.047
7.94%
1 jan 1974 ano
55.641
+0.649
1.18%
1 jan 1975 ano
54.795
-0.846
-1.52%
1 jan 1976 ano
55.412
+0.617
1.13%
1 jan 1977 ano
55.789
+0.377
0.68%
1 jan 1978 ano
46.484
-9.304
-16.68%
1 jan 1979 ano
63.914
+17.429
37.5%
1 jan 1980 ano
64.794
+0.88
1.38%
1 jan 1981 ano
65.094
+0.299
0.46%
1 jan 1982 ano
65.762
+0.668
1.03%
1 jan 1983 ano
65.855
+0.093
0.14%
1 jan 1984 ano
65.74
-0.115
-0.17%
1 jan 1985 ano
65.841
+0.101
0.15%
1 jan 1986 ano
66.22
+0.379
0.58%
1 jan 1987 ano
66.631
+0.411
0.62%
1 jan 1988 ano
68.464
+1.833
2.75%
1 jan 1989 ano
70.683
+2.218
3.24%
1 jan 1990 ano
72.017
+1.334
1.89%
1 jan 1991 ano
75.458
+3.441
4.78%
1 jan 1992 ano
76.892
+1.434
1.9%
1 jan 1993 ano
79.398
+2.505
3.26%
1 jan 1994 ano
80.863
+1.465
1.85%
1 jan 1995 ano
80.015
-0.848
-1.05%
1 jan 1996 ano
80.567
+0.553
0.69%
1 jan 1997 ano
81.413
+0.846
1.05%
1 jan 1998 ano
83.172
+1.759
2.16%
1 jan 2002 ano
87.534
+4.362
5.24%
1 jan 2003 ano
87.606
+0.072
0.08%
1 jan 2004 ano
88.501
+0.895
1.02%
1 jan 2005 ano
89.661
+1.16
1.31%
1 jan 2006 ano
94.429
+4.768
5.32%
1 jan 2007 ano
98.558
+4.129
4.37%
1 jan 2008 ano
101.5
+2.943
2.99%
1 jan 2009 ano
103.351
+1.85
1.82%
1 jan 2010 ano
106.15
+2.799
2.71%
1 jan 2011 ano
103.411
-2.739
-2.58%
1 jan 2012 ano
101.663
-1.748
-1.69%
1 jan 2013 ano
99.688
-1.975
-1.94%
1 jan 2014 ano
96.664
-3.024
-3.03%
1 jan 2015 ano
92.795
-3.869
-4.0%
1 jan 2016 ano
90.293
-2.502
-2.7%
Classificação de países por estatísticas atuais por anos


Comentários: