29
/pt/
pt
AIzaSyAYiBZKx7MnpbEhh9jyipgxe19OcubqV5w
April 1, 2024
38062
IDA blend
IDB
false
2
1
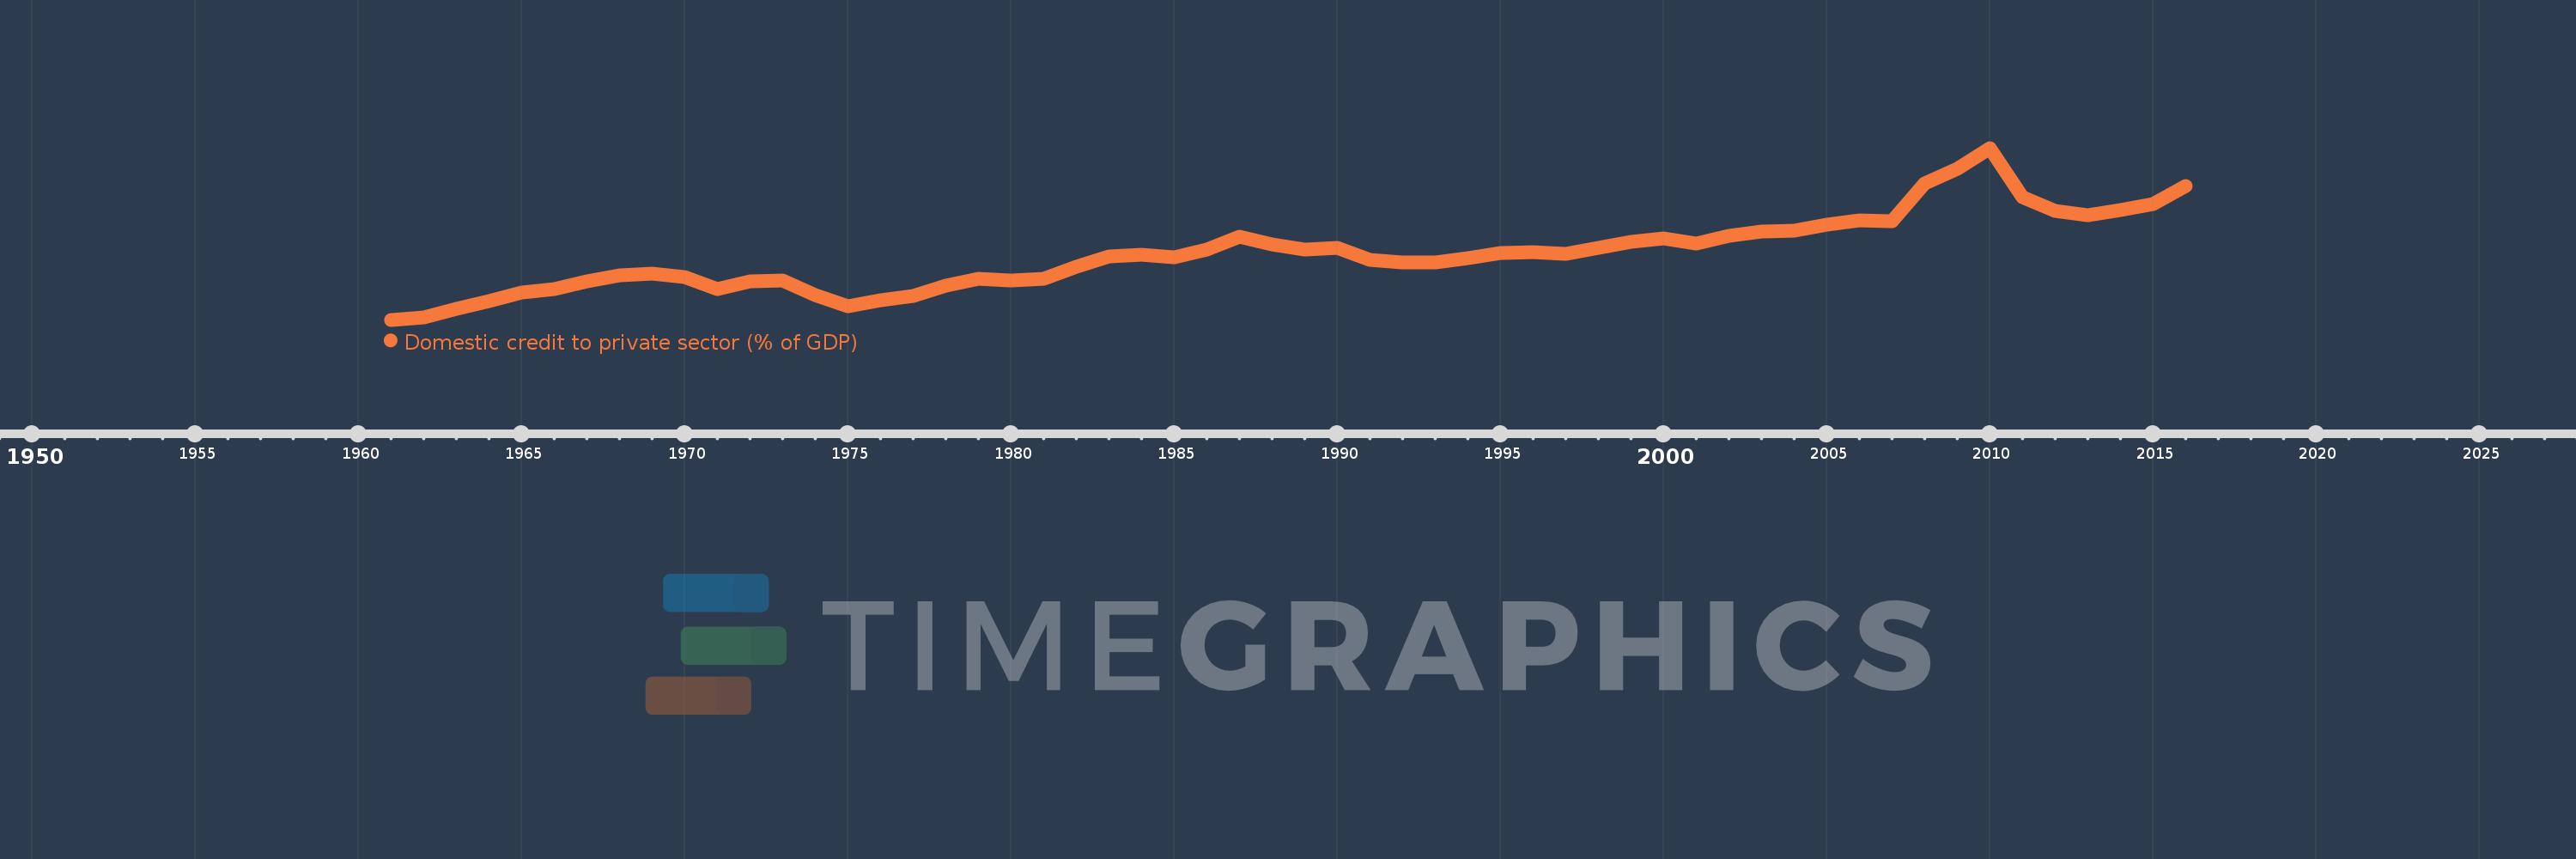
Domestic credit to private sector (% of GDP)
2016,2015,2014,2013,2012,2011,2010,2009,2008,2007,2006,2005,2004,2003,2002,2001,2000,1999,1998,1997,1996,1995,1994,1993,1992,1991,1990,1989,1988,1987,1986,1985,1984,1983,1982,1981,1980,1979,1978,1977,1976,1975,1974,1973,1972,1971,1970,1969,1968,1967,1966,1965,1964,1963,1962,1961
Estas estatísticas em outros países:
AfghanistanAlbaniaAlgeriaAngolaAntigua and BarbudaArab WorldArgentinaArmeniaArubaAustraliaAustriaAzerbaijanBahamas, TheBahrainBangladeshBarbadosBelarusBelgiumBelizeBeninBhutanBoliviaBosnia and HerzegovinaBotswanaBrazilBrunei DarussalamBulgariaBurkina FasoBurundiCabo VerdeCambodiaCameroonCanadaCaribbean small statesCentral African RepublicCentral Europe and the BalticsChadChileChinaColombiaComorosCongo, Dem. Rep.Congo, Rep.Costa RicaCote d'IvoireCroatiaCyprusCzech RepublicDenmarkDjiboutiDominicaDominican RepublicEarly-demographic dividendEast Asia & PacificEast Asia & Pacific (excluding high income)East Asia & Pacific (IDA & IBRD countries)EcuadorEgypt, Arab Rep.El SalvadorEquatorial GuineaEritreaEstoniaEthiopiaEuro areaEurope & Central AsiaEurope & Central Asia (excluding high income)Europe & Central Asia (IDA & IBRD countries)European UnionFijiFinlandFragile and conflict affected situationsFranceGabonGambia, TheGeorgiaGermanyGhanaGreeceGrenadaGuatemalaGuineaGuinea-BissauGuyanaHaitiHeavily indebted poor countries (HIPC)High incomeHondurasHong Kong SAR, ChinaHungaryIBRD onlyIcelandIDA & IBRD totalIDA blendIDA onlyIDA totalIndiaIndonesiaIran, Islamic Rep.IraqIrelandIsraelItalyJamaicaJapanJordanKazakhstanKenyaKorea, Rep.KosovoKuwaitKyrgyz RepublicLao PDRLate-demographic dividendLatin America & Caribbean Latin America & Caribbean (excluding high income)Latin America & the Caribbean (IDA & IBRD countries)LatviaLeast developed countries: UN classificationLebanonLesothoLiberiaLibyaLithuaniaLow & middle incomeLow incomeLower middle incomeLuxembourgMacao SAR, ChinaMacedonia, FYRMadagascarMalawiMalaysiaMaldivesMaliMaltaMauritaniaMauritiusMexicoMicronesia, Fed. Sts.Middle East & North AfricaMiddle East & North Africa (excluding high income)Middle East & North Africa (IDA & IBRD countries)Middle incomeMoldovaMongoliaMontenegroMoroccoMozambiqueMyanmarNamibiaNepalNetherlandsNew ZealandNicaraguaNigerNigeriaNorth AmericaNorwayOECD membersOmanOther small statesPacific island small statesPakistanPanamaPapua New GuineaParaguayPeruPhilippinesPolandPortugalPost-demographic dividendPre-demographic dividendQatarRomaniaRussian FederationRwandaSamoaSao Tome and PrincipeSaudi ArabiaSenegalSerbiaSeychellesSierra LeoneSingaporeSlovak RepublicSloveniaSmall statesSolomon IslandsSouth AfricaSouth AsiaSouth Asia (IDA & IBRD)South SudanSpainSri LankaSt. Kitts and NevisSt. LuciaSt. Vincent and the GrenadinesSub-Saharan Africa Sub-Saharan Africa (excluding high income)Sub-Saharan Africa (IDA & IBRD countries)SudanSurinameSwazilandSwedenSwitzerlandSyrian Arab RepublicTajikistanTanzaniaThailandTimor-LesteTogoTongaTrinidad and TobagoTunisiaTurkeyUgandaUkraineUnited Arab EmiratesUnited KingdomUnited StatesUpper middle incomeUruguayVanuatuVenezuela, RBVietnamWest Bank and GazaWorldYemen, Rep.ZambiaZimbabwe Linha do tempo:
Nesta escala de tempo está apresentado um gráfico de 1961 ano até 2016 ano IDA blend. Dados de 1960 ano ausente. O número de observações reais por data: 56.
Fonte (nome):
Indicadores de desenvolvimento mundial
Fonte (organização):
International Monetary Fund, International Financial Statistics and data files, and World Bank and OECD GDP estimates.
Categorias:
Financial Sector, Private Sector
Foi atualizado:
23 abr 2017 ano
Indicadores de alterações dos valores ao longo dos anos
Mínimo:
7.213
1 jan 1961 ano
Máximo:
43.434
1 jan 2010 ano
Na data de observação
Valor
Mudança absoluta
A alteração em relação ao valor anterior
1 jan 1961 ano
7.213
+7.213
0.0%
1 jan 1962 ano
7.676
+0.464
6.43%
1 jan 1963 ano
9.504
+1.828
23.81%
1 jan 1964 ano
11.193
+1.689
17.77%
1 jan 1965 ano
13.014
+1.822
16.28%
1 jan 1966 ano
13.641
+0.626
4.81%
1 jan 1967 ano
15.238
+1.598
11.71%
1 jan 1968 ano
16.622
+1.383
9.08%
1 jan 1969 ano
16.894
+0.273
1.64%
1 jan 1970 ano
16.213
-0.681
-4.03%
1 jan 1971 ano
13.677
-2.536
-15.64%
1 jan 1972 ano
15.288
+1.611
11.78%
1 jan 1973 ano
15.52
+0.231
1.51%
1 jan 1974 ano
12.368
-3.152
-20.31%
1 jan 1975 ano
10.018
-2.35
-19.0%
1 jan 1976 ano
11.348
+1.33
13.28%
1 jan 1977 ano
12.273
+0.925
8.15%
1 jan 1978 ano
14.39
+2.117
17.25%
1 jan 1979 ano
15.793
+1.403
9.75%
1 jan 1980 ano
15.541
-0.252
-1.59%
1 jan 1981 ano
15.888
+0.347
2.23%
1 jan 1982 ano
18.453
+2.564
16.14%
1 jan 1983 ano
20.487
+2.034
11.02%
1 jan 1984 ano
20.934
+0.446
2.18%
1 jan 1985 ano
20.42
-0.514
-2.45%
1 jan 1986 ano
21.957
+1.537
7.53%
1 jan 1987 ano
24.793
+2.836
12.92%
1 jan 1988 ano
23.046
-1.748
-7.05%
1 jan 1989 ano
22.066
-0.98
-4.25%
1 jan 1990 ano
22.378
+0.312
1.41%
1 jan 1991 ano
19.78
-2.598
-11.61%
1 jan 1992 ano
19.355
-0.424
-2.14%
1 jan 1993 ano
19.222
-0.133
-0.69%
1 jan 1994 ano
20.273
+1.05
5.46%
1 jan 1995 ano
21.263
+0.99
4.88%
1 jan 1996 ano
21.464
+0.201
0.95%
1 jan 1997 ano
21.127
-0.337
-1.57%
1 jan 1998 ano
22.304
+1.177
5.57%
1 jan 1999 ano
23.601
+1.296
5.81%
1 jan 2000 ano
24.406
+0.806
3.41%
1 jan 2001 ano
23.222
-1.184
-4.85%
1 jan 2002 ano
24.969
+1.747
7.52%
1 jan 2003 ano
25.884
+0.915
3.66%
1 jan 2004 ano
26.053
+0.169
0.65%
1 jan 2005 ano
27.332
+1.279
4.91%
1 jan 2006 ano
28.148
+0.816
2.99%
1 jan 2007 ano
28.007
-0.141
-0.5%
1 jan 2008 ano
35.989
+7.982
28.5%
1 jan 2009 ano
38.945
+2.957
8.22%
1 jan 2010 ano
43.434
+4.488
11.52%
1 jan 2011 ano
33.045
-10.389
-23.92%
1 jan 2012 ano
30.23
-2.815
-8.52%
1 jan 2013 ano
29.312
-0.918
-3.04%
1 jan 2014 ano
30.256
+0.945
3.22%
1 jan 2015 ano
31.595
+1.339
4.43%
1 jan 2016 ano
35.48
+3.885
12.3%
Classificação de países por estatísticas atuais por anos


Comentários: