29
/pt/
pt
AIzaSyAYiBZKx7MnpbEhh9jyipgxe19OcubqV5w
April 1, 2024
36479
IBRD only
IBD
false
2
1
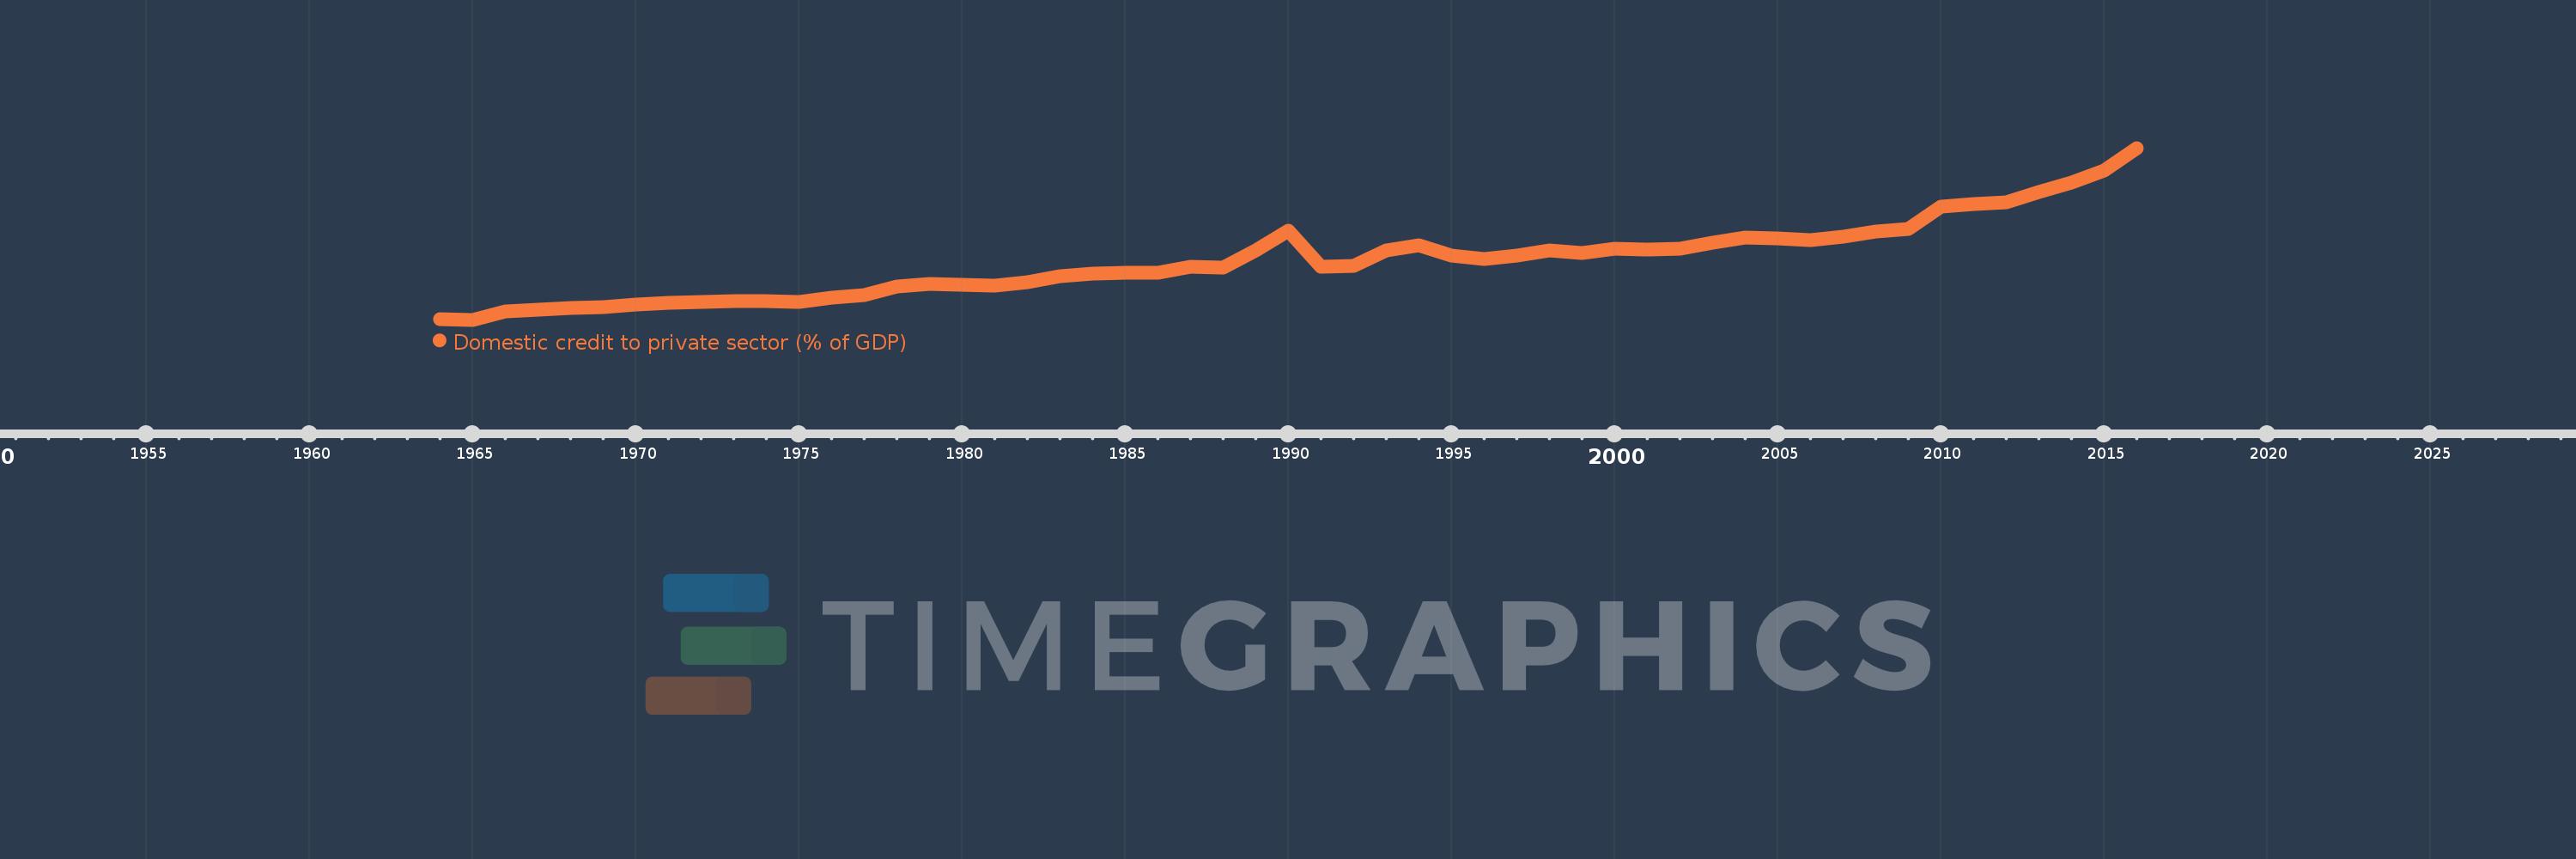
Domestic credit to private sector (% of GDP)
2016,2015,2014,2013,2012,2011,2010,2009,2008,2007,2006,2005,2004,2003,2002,2001,2000,1999,1998,1997,1996,1995,1994,1993,1992,1991,1990,1989,1988,1987,1986,1985,1984,1983,1982,1981,1980,1979,1978,1977,1976,1975,1974,1973,1972,1971,1970,1969,1968,1967,1966,1965,1964
Estas estatísticas em outros países:
AfghanistanAlbaniaAlgeriaAngolaAntigua and BarbudaArab WorldArgentinaArmeniaArubaAustraliaAustriaAzerbaijanBahamas, TheBahrainBangladeshBarbadosBelarusBelgiumBelizeBeninBhutanBoliviaBosnia and HerzegovinaBotswanaBrazilBrunei DarussalamBulgariaBurkina FasoBurundiCabo VerdeCambodiaCameroonCanadaCaribbean small statesCentral African RepublicCentral Europe and the BalticsChadChileChinaColombiaComorosCongo, Dem. Rep.Congo, Rep.Costa RicaCote d'IvoireCroatiaCyprusCzech RepublicDenmarkDjiboutiDominicaDominican RepublicEarly-demographic dividendEast Asia & PacificEast Asia & Pacific (excluding high income)East Asia & Pacific (IDA & IBRD countries)EcuadorEgypt, Arab Rep.El SalvadorEquatorial GuineaEritreaEstoniaEthiopiaEuro areaEurope & Central AsiaEurope & Central Asia (excluding high income)Europe & Central Asia (IDA & IBRD countries)European UnionFijiFinlandFragile and conflict affected situationsFranceGabonGambia, TheGeorgiaGermanyGhanaGreeceGrenadaGuatemalaGuineaGuinea-BissauGuyanaHaitiHeavily indebted poor countries (HIPC)High incomeHondurasHong Kong SAR, ChinaHungaryIBRD onlyIcelandIDA & IBRD totalIDA blendIDA onlyIDA totalIndiaIndonesiaIran, Islamic Rep.IraqIrelandIsraelItalyJamaicaJapanJordanKazakhstanKenyaKorea, Rep.KosovoKuwaitKyrgyz RepublicLao PDRLate-demographic dividendLatin America & Caribbean Latin America & Caribbean (excluding high income)Latin America & the Caribbean (IDA & IBRD countries)LatviaLeast developed countries: UN classificationLebanonLesothoLiberiaLibyaLithuaniaLow & middle incomeLow incomeLower middle incomeLuxembourgMacao SAR, ChinaMacedonia, FYRMadagascarMalawiMalaysiaMaldivesMaliMaltaMauritaniaMauritiusMexicoMicronesia, Fed. Sts.Middle East & North AfricaMiddle East & North Africa (excluding high income)Middle East & North Africa (IDA & IBRD countries)Middle incomeMoldovaMongoliaMontenegroMoroccoMozambiqueMyanmarNamibiaNepalNetherlandsNew ZealandNicaraguaNigerNigeriaNorth AmericaNorwayOECD membersOmanOther small statesPacific island small statesPakistanPanamaPapua New GuineaParaguayPeruPhilippinesPolandPortugalPost-demographic dividendPre-demographic dividendQatarRomaniaRussian FederationRwandaSamoaSao Tome and PrincipeSaudi ArabiaSenegalSerbiaSeychellesSierra LeoneSingaporeSlovak RepublicSloveniaSmall statesSolomon IslandsSouth AfricaSouth AsiaSouth Asia (IDA & IBRD)South SudanSpainSri LankaSt. Kitts and NevisSt. LuciaSt. Vincent and the GrenadinesSub-Saharan Africa Sub-Saharan Africa (excluding high income)Sub-Saharan Africa (IDA & IBRD countries)SudanSurinameSwazilandSwedenSwitzerlandSyrian Arab RepublicTajikistanTanzaniaThailandTimor-LesteTogoTongaTrinidad and TobagoTunisiaTurkeyUgandaUkraineUnited Arab EmiratesUnited KingdomUnited StatesUpper middle incomeUruguayVanuatuVenezuela, RBVietnamWest Bank and GazaWorldYemen, Rep.ZambiaZimbabwe Linha do tempo:
Nesta escala de tempo está apresentado um gráfico de 1964 ano até 2016 ano IBRD only. Dados de 1963 ano ausente. O número de observações reais por data: 53.
Fonte (nome):
Indicadores de desenvolvimento mundial
Fonte (organização):
International Monetary Fund, International Financial Statistics and data files, and World Bank and OECD GDP estimates.
Categorias:
Financial Sector, Private Sector
Foi atualizado:
23 abr 2017 ano
Indicadores de alterações dos valores ao longo dos anos
Mínimo:
14.132
1 jan 1965 ano
Máximo:
100.547
1 jan 2016 ano
Na data de observação
Valor
Mudança absoluta
A alteração em relação ao valor anterior
1 jan 1964 ano
14.306
+14.306
0.0%
1 jan 1965 ano
14.132
-0.174
-1.22%
1 jan 1966 ano
18.289
+4.157
29.42%
1 jan 1967 ano
19.329
+1.04
5.69%
1 jan 1968 ano
19.982
+0.653
3.38%
1 jan 1969 ano
20.535
+0.553
2.77%
1 jan 1970 ano
21.646
+1.111
5.41%
1 jan 1971 ano
22.587
+0.941
4.35%
1 jan 1972 ano
23.131
+0.543
2.41%
1 jan 1973 ano
23.615
+0.484
2.09%
1 jan 1974 ano
23.53
-0.086
-0.36%
1 jan 1975 ano
22.869
-0.66
-2.81%
1 jan 1976 ano
25.273
+2.403
10.51%
1 jan 1977 ano
26.361
+1.088
4.31%
1 jan 1978 ano
30.806
+4.445
16.86%
1 jan 1979 ano
32.003
+1.197
3.89%
1 jan 1980 ano
31.549
-0.454
-1.42%
1 jan 1981 ano
31.289
-0.26
-0.82%
1 jan 1982 ano
33.049
+1.76
5.62%
1 jan 1983 ano
35.963
+2.914
8.82%
1 jan 1984 ano
37.2
+1.237
3.44%
1 jan 1985 ano
37.637
+0.437
1.17%
1 jan 1986 ano
37.798
+0.162
0.43%
1 jan 1987 ano
40.653
+2.855
7.55%
1 jan 1988 ano
40.44
-0.213
-0.52%
1 jan 1989 ano
48.834
+8.394
20.76%
1 jan 1990 ano
59.078
+10.244
20.98%
1 jan 1991 ano
40.944
-18.134
-30.69%
1 jan 1992 ano
41.108
+0.164
0.4%
1 jan 1993 ano
49.008
+7.899
19.22%
1 jan 1994 ano
51.441
+2.433
4.96%
1 jan 1995 ano
46.444
-4.997
-9.71%
1 jan 1996 ano
44.638
-1.806
-3.89%
1 jan 1997 ano
46.4
+1.762
3.95%
1 jan 1998 ano
49.12
+2.72
5.86%
1 jan 1999 ano
47.827
-1.293
-2.63%
1 jan 2000 ano
49.958
+2.132
4.46%
1 jan 2001 ano
49.419
-0.539
-1.08%
1 jan 2002 ano
49.72
+0.301
0.61%
1 jan 2003 ano
52.868
+3.147
6.33%
1 jan 2004 ano
55.493
+2.626
4.97%
1 jan 2005 ano
54.942
-0.551
-0.99%
1 jan 2006 ano
53.999
-0.943
-1.72%
1 jan 2007 ano
55.872
+1.873
3.47%
1 jan 2008 ano
58.612
+2.74
4.9%
1 jan 2009 ano
59.902
+1.29
2.2%
1 jan 2010 ano
70.999
+11.097
18.52%
1 jan 2011 ano
72.232
+1.233
1.74%
1 jan 2012 ano
73.351
+1.119
1.55%
1 jan 2013 ano
78.374
+5.023
6.85%
1 jan 2014 ano
83.298
+4.924
6.28%
1 jan 2015 ano
89.393
+6.095
7.32%
1 jan 2016 ano
100.547
+11.154
12.48%
Classificação de países por estatísticas atuais por anos


Comentários: