29
/pt/
pt
AIzaSyAYiBZKx7MnpbEhh9jyipgxe19OcubqV5w
April 1, 2024
92016
Brazil
BRA
true
2
1
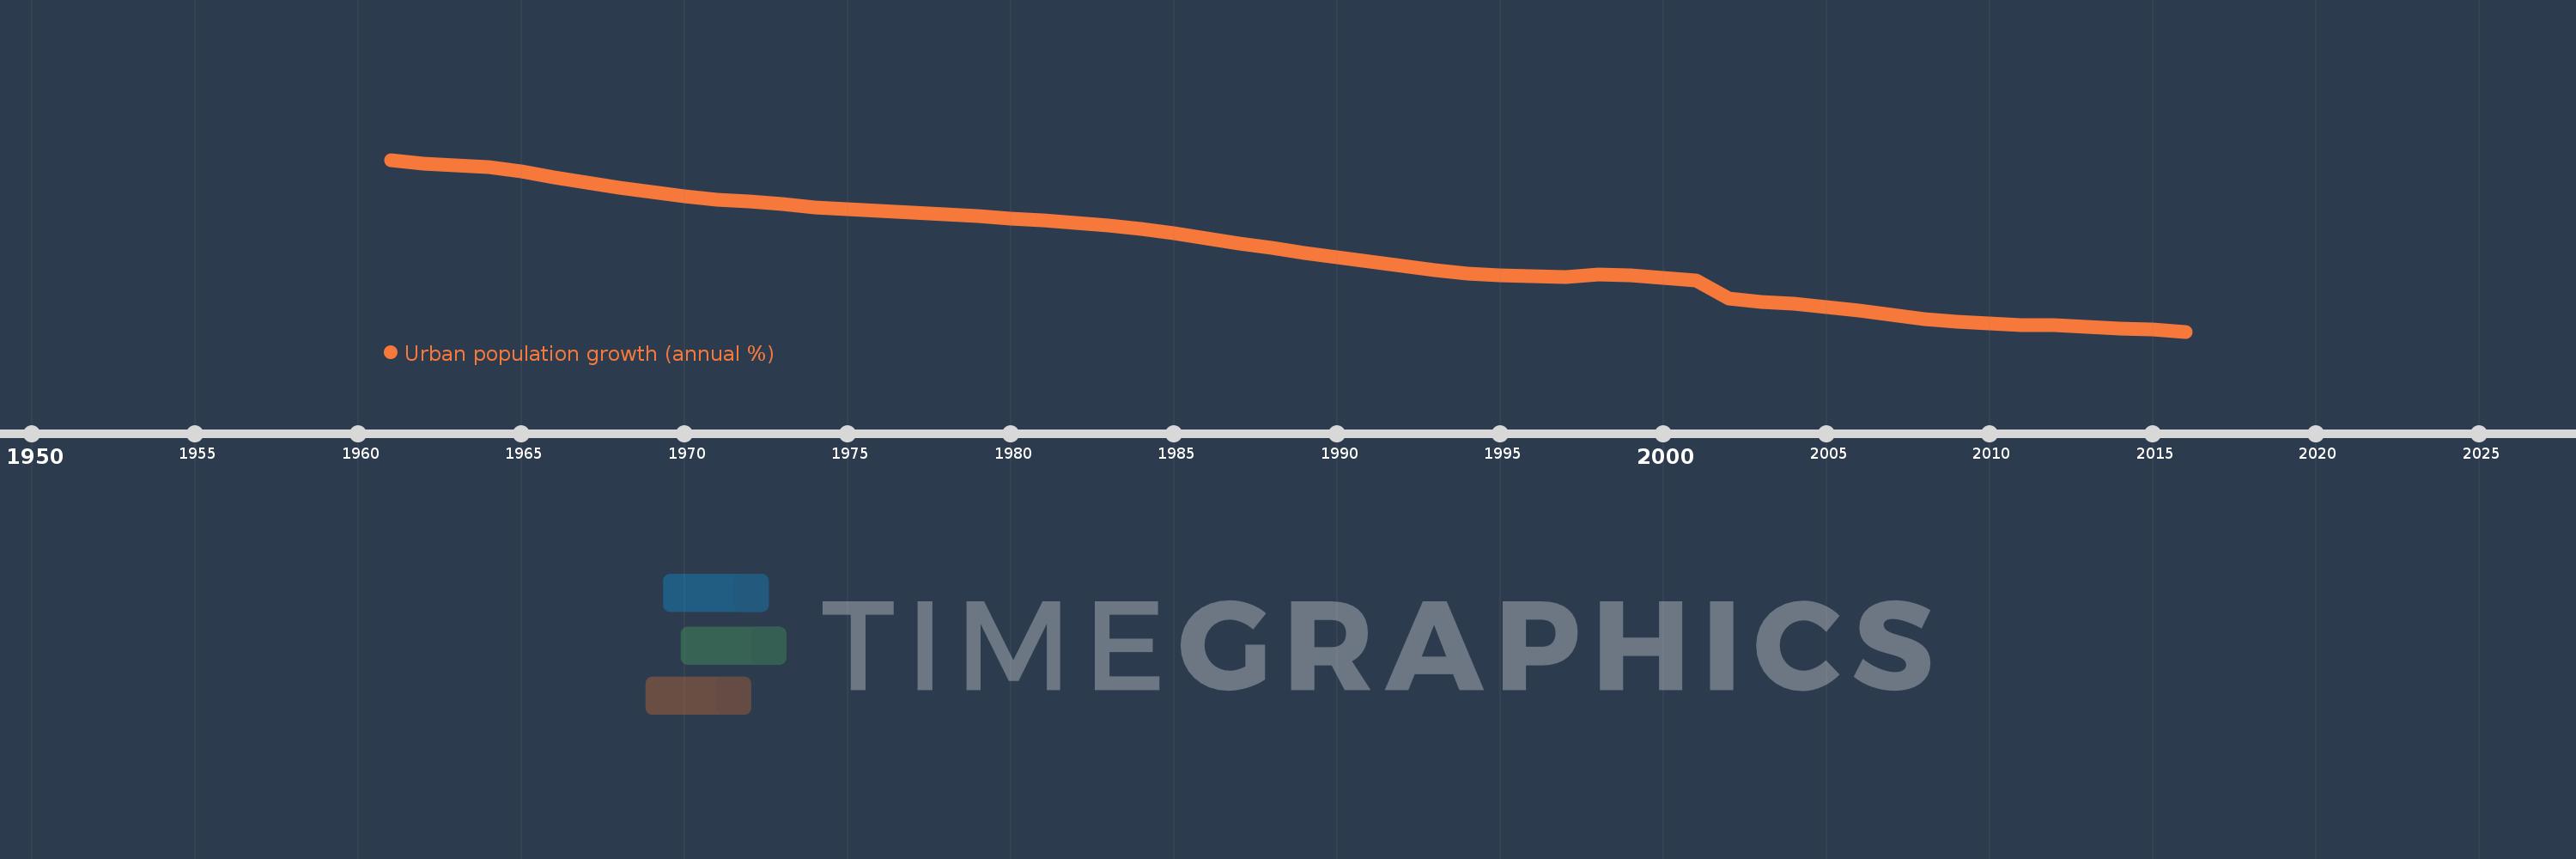
Urban population growth (annual %)
2016,2015,2014,2013,2012,2011,2010,2009,2008,2007,2006,2005,2004,2003,2002,2001,2000,1999,1998,1997,1996,1995,1994,1993,1992,1991,1990,1989,1988,1987,1986,1985,1984,1983,1982,1981,1980,1979,1978,1977,1976,1975,1974,1973,1972,1971,1970,1969,1968,1967,1966,1965,1964,1963,1962,1961
Estas estatísticas em outros países:
AfghanistanAlbaniaAlgeriaAmerican SamoaAndorraAngolaAntigua and BarbudaArab WorldArgentinaArmeniaArubaAustraliaAustriaAzerbaijanBahamas, TheBahrainBangladeshBarbadosBelarusBelgiumBelizeBeninBermudaBhutanBoliviaBosnia and HerzegovinaBotswanaBrazilBritish Virgin IslandsBrunei DarussalamBulgariaBurkina FasoBurundiCabo VerdeCambodiaCameroonCanadaCaribbean small statesCayman IslandsCentral African RepublicCentral Europe and the BalticsChadChannel IslandsChileChinaColombiaComorosCongo, Dem. Rep.Congo, Rep.Costa RicaCote d'IvoireCroatiaCubaCuracaoCyprusCzech RepublicDenmarkDjiboutiDominicaDominican RepublicEarly-demographic dividendEast Asia & PacificEast Asia & Pacific (excluding high income)East Asia & Pacific (IDA & IBRD countries)EcuadorEgypt, Arab Rep.El SalvadorEquatorial GuineaEritreaEstoniaEthiopiaEuro areaEurope & Central AsiaEurope & Central Asia (excluding high income)Europe & Central Asia (IDA & IBRD countries)European UnionFaroe IslandsFijiFinlandFragile and conflict affected situationsFranceFrench PolynesiaGabonGambia, TheGeorgiaGermanyGhanaGibraltarGreeceGreenlandGrenadaGuamGuatemalaGuineaGuinea-BissauGuyanaHaitiHeavily indebted poor countries (HIPC)High incomeHondurasHong Kong SAR, ChinaHungaryIBRD onlyIcelandIDA & IBRD totalIDA blendIDA onlyIDA totalIndiaIndonesiaIran, Islamic Rep.IraqIrelandIsle of ManIsraelItalyJamaicaJapanJordanKazakhstanKenyaKiribatiKorea, Dem. People’s Rep.Korea, Rep.KuwaitKyrgyz RepublicLao PDRLate-demographic dividendLatin America & Caribbean Latin America & Caribbean (excluding high income)Latin America & the Caribbean (IDA & IBRD countries)LatviaLeast developed countries: UN classificationLebanonLesothoLiberiaLibyaLiechtensteinLithuaniaLow & middle incomeLow incomeLower middle incomeLuxembourgMacao SAR, ChinaMacedonia, FYRMadagascarMalawiMalaysiaMaldivesMaliMaltaMarshall IslandsMauritaniaMauritiusMexicoMicronesia, Fed. Sts.Middle East & North AfricaMiddle East & North Africa (excluding high income)Middle East & North Africa (IDA & IBRD countries)Middle incomeMoldovaMonacoMongoliaMontenegroMoroccoMozambiqueMyanmarNamibiaNauruNepalNetherlandsNew CaledoniaNew ZealandNicaraguaNigerNigeriaNorth AmericaNorthern Mariana IslandsNorwayOECD membersOmanOther small statesPacific island small statesPakistanPalauPanamaPapua New GuineaParaguayPeruPhilippinesPolandPortugalPost-demographic dividendPre-demographic dividendPuerto RicoQatarRomaniaRussian FederationRwandaSamoaSan MarinoSao Tome and PrincipeSaudi ArabiaSenegalSerbiaSeychellesSierra LeoneSingaporeSint Maarten (Dutch part)Slovak RepublicSloveniaSmall statesSolomon IslandsSomaliaSouth AfricaSouth AsiaSouth Asia (IDA & IBRD)South SudanSpainSri LankaSt. Kitts and NevisSt. LuciaSt. Vincent and the GrenadinesSub-Saharan Africa Sub-Saharan Africa (excluding high income)Sub-Saharan Africa (IDA & IBRD countries)SudanSurinameSwazilandSwedenSwitzerlandSyrian Arab RepublicTajikistanTanzaniaThailandTimor-LesteTogoTongaTrinidad and TobagoTunisiaTurkeyTurkmenistanTurks and Caicos IslandsTuvaluUgandaUkraineUnited Arab EmiratesUnited KingdomUnited StatesUpper middle incomeUruguayUzbekistanVanuatuVenezuela, RBVietnamVirgin Islands (U.S.)West Bank and GazaWorldYemen, Rep.ZambiaZimbabwe Linha do tempo:
Nesta escala de tempo está apresentado um gráfico de 1961 ano até 2016 ano Brazil. Dados de 1960 ano ausente. O número de observações reais por data: 56.
Fonte (nome):
Indicadores de desenvolvimento mundial
Fonte (organização):
World Bank Staff estimates based on United Nations, World Urbanization Prospects.
Categorias:
Climate Change, Urban Development
Foi atualizado:
23 abr 2017 ano
Indicadores de alterações dos valores ao longo dos anos
Mínimo:
1.152
1 jan 2016 ano
Máximo:
5.216
1 jan 1961 ano
Na data de observação
Valor
Mudança absoluta
A alteração em relação ao valor anterior
1 jan 1961 ano
5.216
+5.216
0.0%
1 jan 1962 ano
5.116
-0.101
-1.93%
1 jan 1963 ano
5.085
-0.03
-0.59%
1 jan 1964 ano
5.035
-0.051
-0.99%
1 jan 1965 ano
4.938
-0.097
-1.92%
1 jan 1966 ano
4.802
-0.135
-2.74%
1 jan 1967 ano
4.672
-0.13
-2.71%
1 jan 1968 ano
4.551
-0.121
-2.59%
1 jan 1969 ano
4.448
-0.104
-2.28%
1 jan 1970 ano
4.349
-0.098
-2.21%
1 jan 1971 ano
4.277
-0.072
-1.66%
1 jan 1972 ano
4.236
-0.041
-0.96%
1 jan 1973 ano
4.168
-0.068
-1.61%
1 jan 1974 ano
4.098
-0.07
-1.67%
1 jan 1975 ano
4.051
-0.047
-1.15%
1 jan 1976 ano
4.01
-0.042
-1.03%
1 jan 1977 ano
3.97
-0.039
-0.98%
1 jan 1978 ano
3.919
-0.051
-1.28%
1 jan 1979 ano
3.875
-0.044
-1.13%
1 jan 1980 ano
3.827
-0.048
-1.24%
1 jan 1981 ano
3.777
-0.05
-1.3%
1 jan 1982 ano
3.72
-0.057
-1.52%
1 jan 1983 ano
3.664
-0.056
-1.51%
1 jan 1984 ano
3.585
-0.079
-2.15%
1 jan 1985 ano
3.482
-0.103
-2.86%
1 jan 1986 ano
3.359
-0.124
-3.55%
1 jan 1987 ano
3.242
-0.116
-3.46%
1 jan 1988 ano
3.127
-0.115
-3.55%
1 jan 1989 ano
3.017
-0.11
-3.53%
1 jan 1990 ano
2.906
-0.111
-3.68%
1 jan 1991 ano
2.803
-0.103
-3.54%
1 jan 1992 ano
2.698
-0.105
-3.75%
1 jan 1993 ano
2.602
-0.096
-3.56%
1 jan 1994 ano
2.526
-0.076
-2.91%
1 jan 1995 ano
2.483
-0.043
-1.71%
1 jan 1996 ano
2.46
-0.023
-0.93%
1 jan 1997 ano
2.441
-0.019
-0.75%
1 jan 1998 ano
2.503
+0.062
2.54%
1 jan 1999 ano
2.473
-0.03
-1.21%
1 jan 2000 ano
2.427
-0.046
-1.88%
1 jan 2001 ano
2.37
-0.056
-2.32%
1 jan 2002 ano
1.93
-0.44
-18.56%
1 jan 2003 ano
1.861
-0.069
-3.57%
1 jan 2004 ano
1.81
-0.052
-2.78%
1 jan 2005 ano
1.732
-0.077
-4.26%
1 jan 2006 ano
1.64
-0.092
-5.33%
1 jan 2007 ano
1.543
-0.097
-5.94%
1 jan 2008 ano
1.454
-0.089
-5.74%
1 jan 2009 ano
1.385
-0.07
-4.79%
1 jan 2010 ano
1.338
-0.046
-3.33%
1 jan 2011 ano
1.313
-0.025
-1.87%
1 jan 2012 ano
1.295
-0.019
-1.43%
1 jan 2013 ano
1.263
-0.032
-2.43%
1 jan 2014 ano
1.231
-0.032
-2.53%
1 jan 2015 ano
1.194
-0.038
-3.06%
1 jan 2016 ano
1.152
-0.042
-3.48%
Classificação de países por estatísticas atuais por anos


Comentários: