29
/pt/
pt
AIzaSyAYiBZKx7MnpbEhh9jyipgxe19OcubqV5w
April 1, 2024
254781
Suriname
SUR
true
2
1
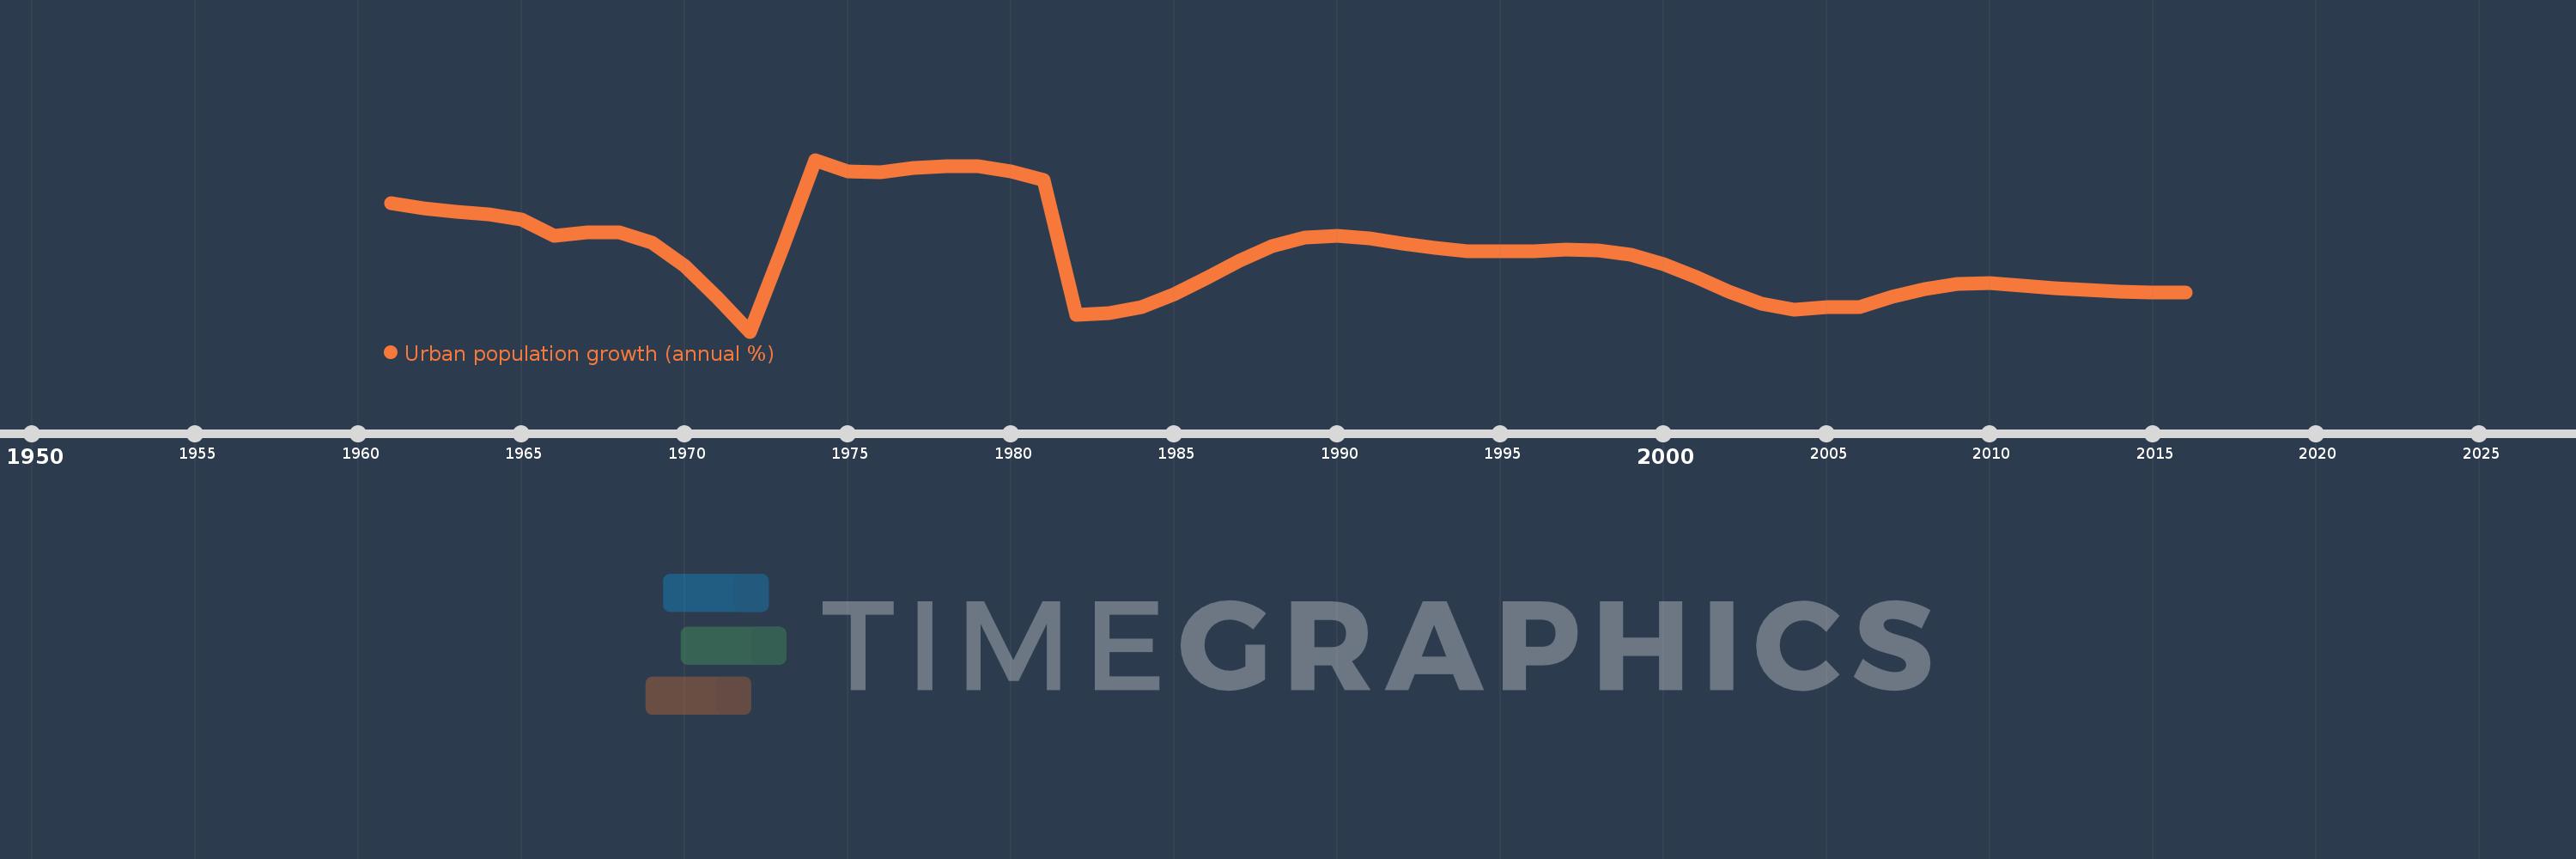
Urban population growth (annual %)
2016,2015,2014,2013,2012,2011,2010,2009,2008,2007,2006,2005,2004,2003,2002,2001,2000,1999,1998,1997,1996,1995,1994,1993,1992,1991,1990,1989,1988,1987,1986,1985,1984,1983,1982,1981,1980,1979,1978,1977,1976,1975,1974,1973,1972,1971,1970,1969,1968,1967,1966,1965,1964,1963,1962,1961
Estas estatísticas em outros países:
AfghanistanAlbaniaAlgeriaAmerican SamoaAndorraAngolaAntigua and BarbudaArab WorldArgentinaArmeniaArubaAustraliaAustriaAzerbaijanBahamas, TheBahrainBangladeshBarbadosBelarusBelgiumBelizeBeninBermudaBhutanBoliviaBosnia and HerzegovinaBotswanaBrazilBritish Virgin IslandsBrunei DarussalamBulgariaBurkina FasoBurundiCabo VerdeCambodiaCameroonCanadaCaribbean small statesCayman IslandsCentral African RepublicCentral Europe and the BalticsChadChannel IslandsChileChinaColombiaComorosCongo, Dem. Rep.Congo, Rep.Costa RicaCote d'IvoireCroatiaCubaCuracaoCyprusCzech RepublicDenmarkDjiboutiDominicaDominican RepublicEarly-demographic dividendEast Asia & PacificEast Asia & Pacific (excluding high income)East Asia & Pacific (IDA & IBRD countries)EcuadorEgypt, Arab Rep.El SalvadorEquatorial GuineaEritreaEstoniaEthiopiaEuro areaEurope & Central AsiaEurope & Central Asia (excluding high income)Europe & Central Asia (IDA & IBRD countries)European UnionFaroe IslandsFijiFinlandFragile and conflict affected situationsFranceFrench PolynesiaGabonGambia, TheGeorgiaGermanyGhanaGibraltarGreeceGreenlandGrenadaGuamGuatemalaGuineaGuinea-BissauGuyanaHaitiHeavily indebted poor countries (HIPC)High incomeHondurasHong Kong SAR, ChinaHungaryIBRD onlyIcelandIDA & IBRD totalIDA blendIDA onlyIDA totalIndiaIndonesiaIran, Islamic Rep.IraqIrelandIsle of ManIsraelItalyJamaicaJapanJordanKazakhstanKenyaKiribatiKorea, Dem. People’s Rep.Korea, Rep.KuwaitKyrgyz RepublicLao PDRLate-demographic dividendLatin America & Caribbean Latin America & Caribbean (excluding high income)Latin America & the Caribbean (IDA & IBRD countries)LatviaLeast developed countries: UN classificationLebanonLesothoLiberiaLibyaLiechtensteinLithuaniaLow & middle incomeLow incomeLower middle incomeLuxembourgMacao SAR, ChinaMacedonia, FYRMadagascarMalawiMalaysiaMaldivesMaliMaltaMarshall IslandsMauritaniaMauritiusMexicoMicronesia, Fed. Sts.Middle East & North AfricaMiddle East & North Africa (excluding high income)Middle East & North Africa (IDA & IBRD countries)Middle incomeMoldovaMonacoMongoliaMontenegroMoroccoMozambiqueMyanmarNamibiaNauruNepalNetherlandsNew CaledoniaNew ZealandNicaraguaNigerNigeriaNorth AmericaNorthern Mariana IslandsNorwayOECD membersOmanOther small statesPacific island small statesPakistanPalauPanamaPapua New GuineaParaguayPeruPhilippinesPolandPortugalPost-demographic dividendPre-demographic dividendPuerto RicoQatarRomaniaRussian FederationRwandaSamoaSan MarinoSao Tome and PrincipeSaudi ArabiaSenegalSerbiaSeychellesSierra LeoneSingaporeSint Maarten (Dutch part)Slovak RepublicSloveniaSmall statesSolomon IslandsSomaliaSouth AfricaSouth AsiaSouth Asia (IDA & IBRD)South SudanSpainSri LankaSt. Kitts and NevisSt. LuciaSt. Vincent and the GrenadinesSub-Saharan Africa Sub-Saharan Africa (excluding high income)Sub-Saharan Africa (IDA & IBRD countries)SudanSurinameSwazilandSwedenSwitzerlandSyrian Arab RepublicTajikistanTanzaniaThailandTimor-LesteTogoTongaTrinidad and TobagoTunisiaTurkeyTurkmenistanTurks and Caicos IslandsTuvaluUgandaUkraineUnited Arab EmiratesUnited KingdomUnited StatesUpper middle incomeUruguayUzbekistanVanuatuVenezuela, RBVietnamVirgin Islands (U.S.)West Bank and GazaWorldYemen, Rep.ZambiaZimbabwe Linha do tempo:
Nesta escala de tempo está apresentado um gráfico de 1961 ano até 2016 ano Suriname. Dados de 1960 ano ausente. O número de observações reais por data: 56.
Fonte (nome):
Indicadores de desenvolvimento mundial
Fonte (organização):
World Bank Staff estimates based on United Nations, World Urbanization Prospects.
Categorias:
Climate Change, Urban Development
Foi atualizado:
23 abr 2017 ano
Indicadores de alterações dos valores ao longo dos anos
Mínimo:
-0.143
1 jan 1972 ano
Máximo:
4.052
1 jan 1974 ano
Na data de observação
Valor
Mudança absoluta
A alteração em relação ao valor anterior
1 jan 1961 ano
2.983
+2.983
0.0%
1 jan 1962 ano
2.873
-0.111
-3.71%
1 jan 1963 ano
2.773
-0.1
-3.46%
1 jan 1964 ano
2.72
-0.053
-1.92%
1 jan 1965 ano
2.59
-0.13
-4.76%
1 jan 1966 ano
2.198
-0.392
-15.15%
1 jan 1967 ano
2.282
+0.084
3.83%
1 jan 1968 ano
2.282
0.0
-0.01%
1 jan 1969 ano
2.029
-0.253
-11.07%
1 jan 1970 ano
1.456
-0.573
-28.24%
1 jan 1971 ano
0.695
-0.761
-52.29%
1 jan 1972 ano
-0.143
-0.837
-120.52%
1 jan 1973 ano
1.908
+2.05
-1.44 mil%
1 jan 1974 ano
4.052
+2.144
112.4%
1 jan 1975 ano
3.762
-0.29
-7.15%
1 jan 1976 ano
3.754
-0.009
-0.23%
1 jan 1977 ano
3.862
+0.109
2.9%
1 jan 1978 ano
3.903
+0.04
1.04%
1 jan 1979 ano
3.899
-0.004
-0.09%
1 jan 1980 ano
3.762
-0.137
-3.52%
1 jan 1981 ano
3.553
-0.209
-5.54%
1 jan 1982 ano
0.262
-3.292
-92.63%
1 jan 1983 ano
0.303
+0.042
15.85%
1 jan 1984 ano
0.456
+0.153
50.26%
1 jan 1985 ano
0.762
+0.306
67.03%
1 jan 1986 ano
1.159
+0.398
52.21%
1 jan 1987 ano
1.584
+0.424
36.62%
1 jan 1988 ano
1.94
+0.356
22.5%
1 jan 1989 ano
2.159
+0.219
11.28%
1 jan 1990 ano
2.206
+0.047
2.18%
1 jan 1991 ano
2.128
-0.078
-3.54%
1 jan 1992 ano
2.003
-0.124
-5.84%
1 jan 1993 ano
1.9
-0.103
-5.17%
1 jan 1994 ano
1.828
-0.072
-3.79%
1 jan 1995 ano
1.81
-0.017
-0.94%
1 jan 1996 ano
1.82
+0.01
0.53%
1 jan 1997 ano
1.851
+0.031
1.71%
1 jan 1998 ano
1.84
-0.011
-0.58%
1 jan 1999 ano
1.732
-0.108
-5.89%
1 jan 2000 ano
1.494
-0.238
-13.76%
1 jan 2001 ano
1.179
-0.314
-21.04%
1 jan 2002 ano
0.827
-0.353
-29.89%
1 jan 2003 ano
0.536
-0.291
-35.17%
1 jan 2004 ano
0.391
-0.145
-27.09%
1 jan 2005 ano
0.451
+0.061
15.52%
1 jan 2006 ano
0.465
+0.014
3.06%
1 jan 2007 ano
0.7
+0.235
50.4%
1 jan 2008 ano
0.901
+0.201
28.74%
1 jan 2009 ano
1.03
+0.129
14.34%
1 jan 2010 ano
1.05
+0.02
1.92%
1 jan 2011 ano
0.988
-0.062
-5.91%
1 jan 2012 ano
0.915
-0.073
-7.4%
1 jan 2013 ano
0.866
-0.049
-5.31%
1 jan 2014 ano
0.823
-0.043
-4.98%
1 jan 2015 ano
0.812
-0.011
-1.33%
1 jan 2016 ano
0.811
-0.001
-0.15%
Classificação de países por estatísticas atuais por anos


Comentários: