29
/pt/
pt
AIzaSyAYiBZKx7MnpbEhh9jyipgxe19OcubqV5w
April 1, 2024
27016
Early-demographic dividend
EAR
false
2
1
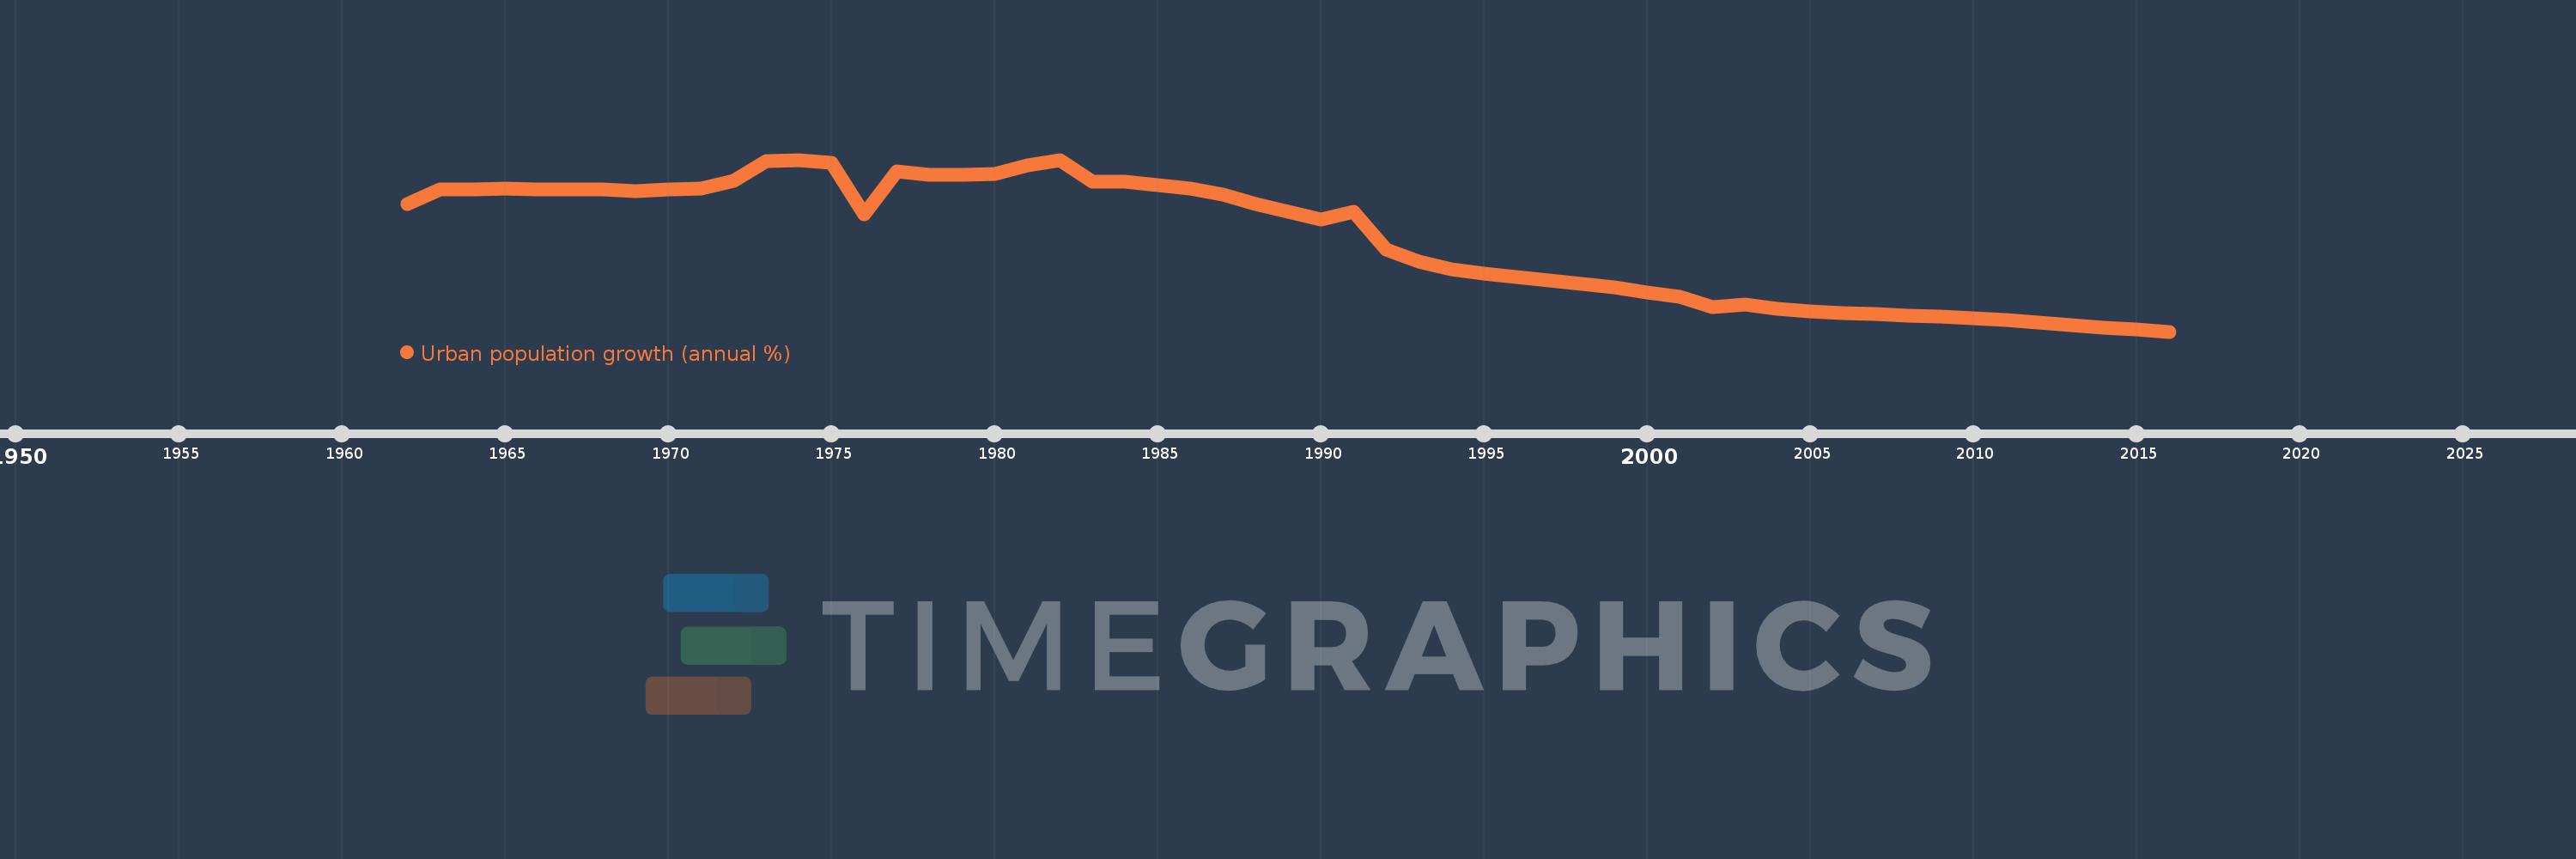
Urban population growth (annual %)
2016,2015,2014,2013,2012,2011,2010,2009,2008,2007,2006,2005,2004,2003,2002,2001,2000,1999,1998,1997,1996,1995,1994,1993,1992,1991,1990,1989,1988,1987,1986,1985,1984,1983,1982,1981,1980,1979,1978,1977,1976,1975,1974,1973,1972,1971,1970,1969,1968,1967,1966,1965,1964,1963,1962
Estas estatísticas em outros países:
AfghanistanAlbaniaAlgeriaAmerican SamoaAndorraAngolaAntigua and BarbudaArab WorldArgentinaArmeniaArubaAustraliaAustriaAzerbaijanBahamas, TheBahrainBangladeshBarbadosBelarusBelgiumBelizeBeninBermudaBhutanBoliviaBosnia and HerzegovinaBotswanaBrazilBritish Virgin IslandsBrunei DarussalamBulgariaBurkina FasoBurundiCabo VerdeCambodiaCameroonCanadaCaribbean small statesCayman IslandsCentral African RepublicCentral Europe and the BalticsChadChannel IslandsChileChinaColombiaComorosCongo, Dem. Rep.Congo, Rep.Costa RicaCote d'IvoireCroatiaCubaCuracaoCyprusCzech RepublicDenmarkDjiboutiDominicaDominican RepublicEarly-demographic dividendEast Asia & PacificEast Asia & Pacific (excluding high income)East Asia & Pacific (IDA & IBRD countries)EcuadorEgypt, Arab Rep.El SalvadorEquatorial GuineaEritreaEstoniaEthiopiaEuro areaEurope & Central AsiaEurope & Central Asia (excluding high income)Europe & Central Asia (IDA & IBRD countries)European UnionFaroe IslandsFijiFinlandFragile and conflict affected situationsFranceFrench PolynesiaGabonGambia, TheGeorgiaGermanyGhanaGibraltarGreeceGreenlandGrenadaGuamGuatemalaGuineaGuinea-BissauGuyanaHaitiHeavily indebted poor countries (HIPC)High incomeHondurasHong Kong SAR, ChinaHungaryIBRD onlyIcelandIDA & IBRD totalIDA blendIDA onlyIDA totalIndiaIndonesiaIran, Islamic Rep.IraqIrelandIsle of ManIsraelItalyJamaicaJapanJordanKazakhstanKenyaKiribatiKorea, Dem. People’s Rep.Korea, Rep.KuwaitKyrgyz RepublicLao PDRLate-demographic dividendLatin America & Caribbean Latin America & Caribbean (excluding high income)Latin America & the Caribbean (IDA & IBRD countries)LatviaLeast developed countries: UN classificationLebanonLesothoLiberiaLibyaLiechtensteinLithuaniaLow & middle incomeLow incomeLower middle incomeLuxembourgMacao SAR, ChinaMacedonia, FYRMadagascarMalawiMalaysiaMaldivesMaliMaltaMarshall IslandsMauritaniaMauritiusMexicoMicronesia, Fed. Sts.Middle East & North AfricaMiddle East & North Africa (excluding high income)Middle East & North Africa (IDA & IBRD countries)Middle incomeMoldovaMonacoMongoliaMontenegroMoroccoMozambiqueMyanmarNamibiaNauruNepalNetherlandsNew CaledoniaNew ZealandNicaraguaNigerNigeriaNorth AmericaNorthern Mariana IslandsNorwayOECD membersOmanOther small statesPacific island small statesPakistanPalauPanamaPapua New GuineaParaguayPeruPhilippinesPolandPortugalPost-demographic dividendPre-demographic dividendPuerto RicoQatarRomaniaRussian FederationRwandaSamoaSan MarinoSao Tome and PrincipeSaudi ArabiaSenegalSerbiaSeychellesSierra LeoneSingaporeSint Maarten (Dutch part)Slovak RepublicSloveniaSmall statesSolomon IslandsSomaliaSouth AfricaSouth AsiaSouth Asia (IDA & IBRD)South SudanSpainSri LankaSt. Kitts and NevisSt. LuciaSt. Vincent and the GrenadinesSub-Saharan Africa Sub-Saharan Africa (excluding high income)Sub-Saharan Africa (IDA & IBRD countries)SudanSurinameSwazilandSwedenSwitzerlandSyrian Arab RepublicTajikistanTanzaniaThailandTimor-LesteTogoTongaTrinidad and TobagoTunisiaTurkeyTurkmenistanTurks and Caicos IslandsTuvaluUgandaUkraineUnited Arab EmiratesUnited KingdomUnited StatesUpper middle incomeUruguayUzbekistanVanuatuVenezuela, RBVietnamVirgin Islands (U.S.)West Bank and GazaWorldYemen, Rep.ZambiaZimbabwe Linha do tempo:
Nesta escala de tempo está apresentado um gráfico de 1962 ano até 2016 ano Early-demographic dividend. Dados de 1961 ano ausente. O número de observações reais por data: 55.
Fonte (nome):
Indicadores de desenvolvimento mundial
Fonte (organização):
World Bank Staff estimates based on United Nations, World Urbanization Prospects.
Categorias:
Climate Change, Urban Development
Foi atualizado:
23 abr 2017 ano
Indicadores de alterações dos valores ao longo dos anos
Mínimo:
2.372
1 jan 2016 ano
Máximo:
4.184
1 jan 1982 ano
Na data de observação
Valor
Mudança absoluta
A alteração em relação ao valor anterior
1 jan 1962 ano
3.719
+3.719
0.0%
1 jan 1963 ano
3.873
+0.154
4.14%
1 jan 1964 ano
3.873
+0.001
0.01%
1 jan 1965 ano
3.882
+0.009
0.23%
1 jan 1966 ano
3.875
-0.007
-0.18%
1 jan 1967 ano
3.869
-0.006
-0.16%
1 jan 1968 ano
3.875
+0.006
0.15%
1 jan 1969 ano
3.856
-0.019
-0.48%
1 jan 1970 ano
3.868
+0.011
0.29%
1 jan 1971 ano
3.882
+0.015
0.38%
1 jan 1972 ano
3.962
+0.08
2.06%
1 jan 1973 ano
4.174
+0.212
5.35%
1 jan 1974 ano
4.18
+0.006
0.14%
1 jan 1975 ano
4.152
-0.028
-0.67%
1 jan 1976 ano
3.607
-0.545
-13.12%
1 jan 1977 ano
4.061
+0.454
12.58%
1 jan 1978 ano
4.021
-0.041
-1.0%
1 jan 1979 ano
4.023
+0.003
0.07%
1 jan 1980 ano
4.038
+0.014
0.35%
1 jan 1981 ano
4.125
+0.087
2.15%
1 jan 1982 ano
4.184
+0.059
1.43%
1 jan 1983 ano
3.955
-0.229
-5.46%
1 jan 1984 ano
3.95
-0.005
-0.14%
1 jan 1985 ano
3.921
-0.029
-0.73%
1 jan 1986 ano
3.88
-0.041
-1.05%
1 jan 1987 ano
3.814
-0.065
-1.68%
1 jan 1988 ano
3.715
-0.1
-2.62%
1 jan 1989 ano
3.64
-0.075
-2.02%
1 jan 1990 ano
3.552
-0.088
-2.41%
1 jan 1991 ano
3.64
+0.088
2.48%
1 jan 1992 ano
3.237
-0.403
-11.08%
1 jan 1993 ano
3.11
-0.126
-3.9%
1 jan 1994 ano
3.031
-0.079
-2.54%
1 jan 1995 ano
2.988
-0.043
-1.43%
1 jan 1996 ano
2.95
-0.038
-1.28%
1 jan 1997 ano
2.914
-0.036
-1.21%
1 jan 1998 ano
2.878
-0.036
-1.23%
1 jan 1999 ano
2.837
-0.041
-1.43%
1 jan 2000 ano
2.784
-0.053
-1.88%
1 jan 2001 ano
2.74
-0.044
-1.57%
1 jan 2002 ano
2.633
-0.107
-3.91%
1 jan 2003 ano
2.657
+0.024
0.92%
1 jan 2004 ano
2.612
-0.046
-1.71%
1 jan 2005 ano
2.589
-0.022
-0.86%
1 jan 2006 ano
2.57
-0.02
-0.76%
1 jan 2007 ano
2.556
-0.014
-0.55%
1 jan 2008 ano
2.537
-0.019
-0.75%
1 jan 2009 ano
2.531
-0.005
-0.22%
1 jan 2010 ano
2.51
-0.021
-0.82%
1 jan 2011 ano
2.493
-0.017
-0.68%
1 jan 2012 ano
2.468
-0.026
-1.02%
1 jan 2013 ano
2.439
-0.029
-1.17%
1 jan 2014 ano
2.416
-0.022
-0.91%
1 jan 2015 ano
2.395
-0.021
-0.88%
1 jan 2016 ano
2.372
-0.024
-0.98%
Classificação de países por estatísticas atuais por anos


Comentários: