29
/pt/
pt
AIzaSyAYiBZKx7MnpbEhh9jyipgxe19OcubqV5w
April 1, 2024
283131
Vietnam
VNM
true
2
1
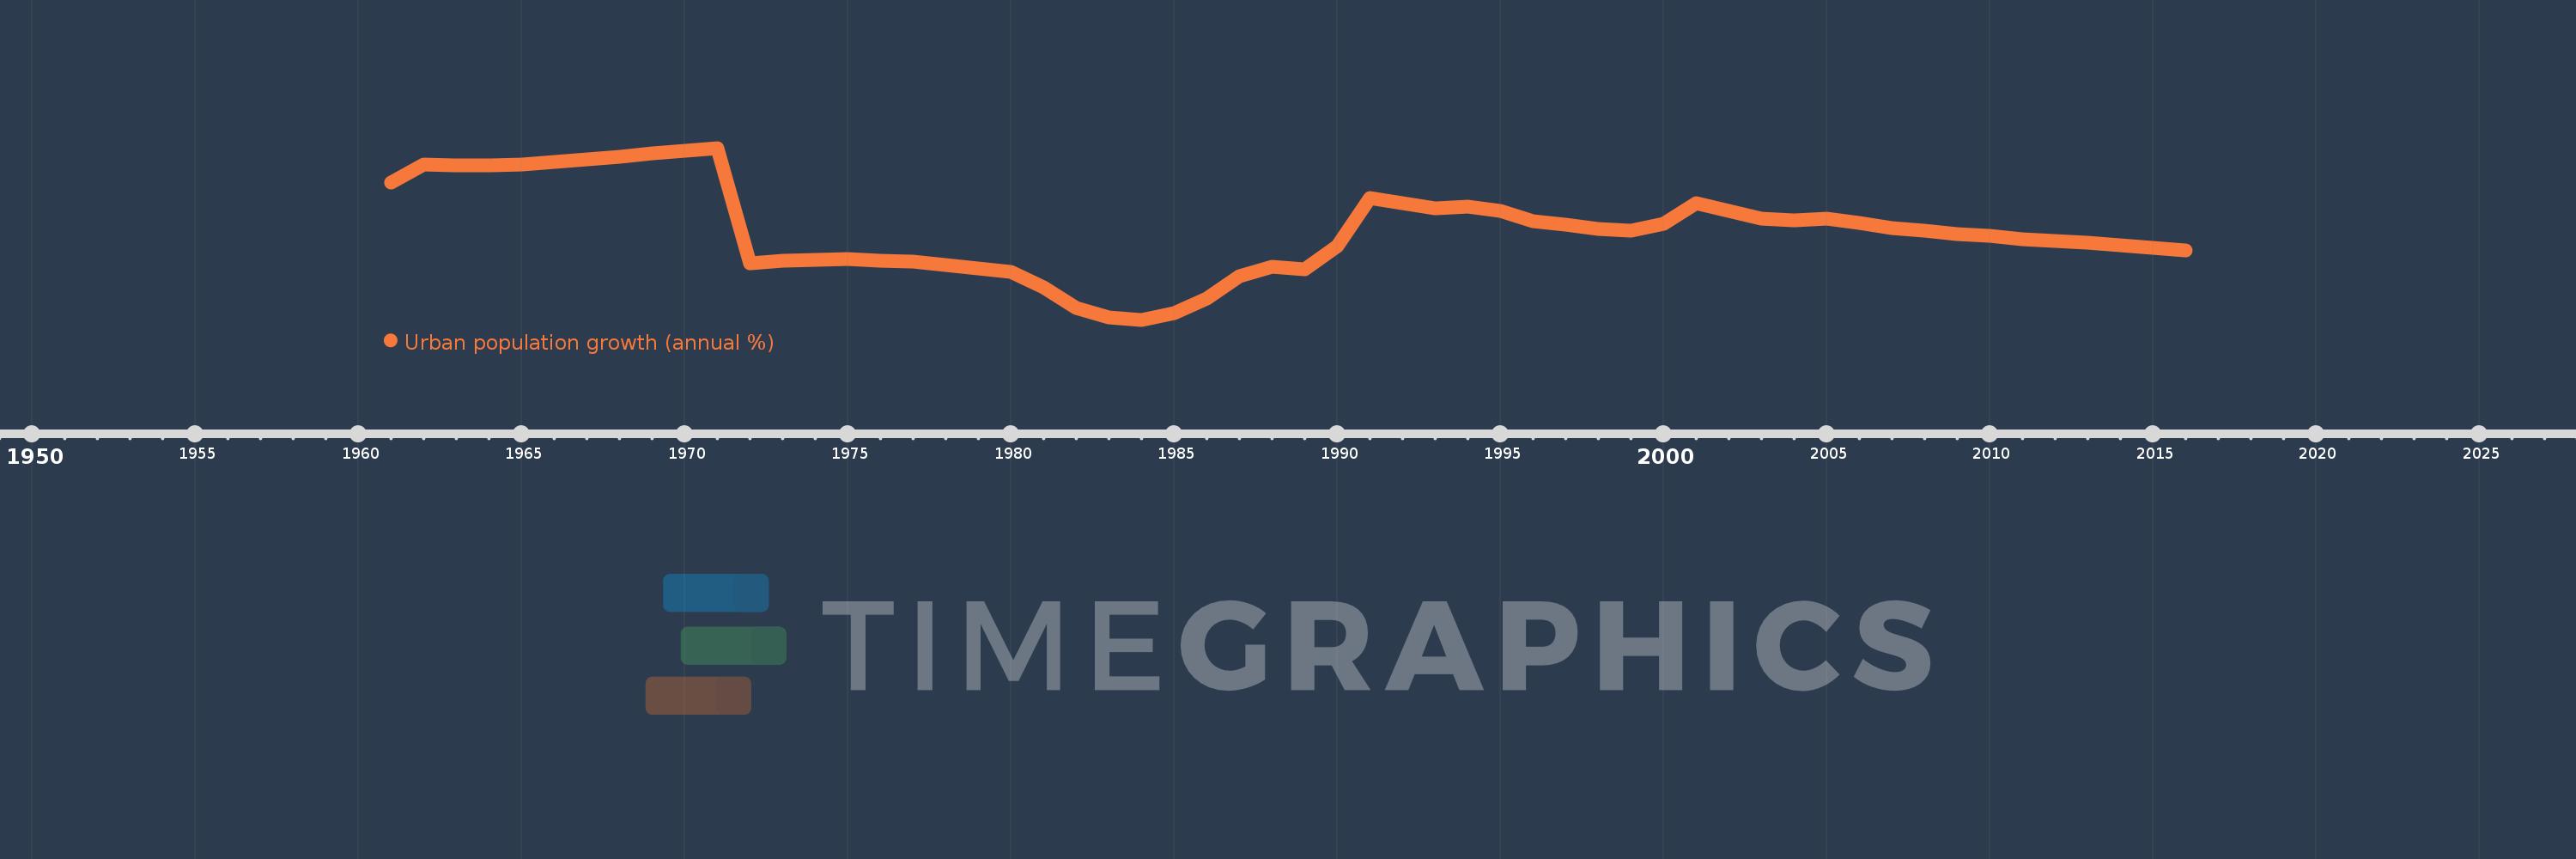
Urban population growth (annual %)
2016,2015,2014,2013,2012,2011,2010,2009,2008,2007,2006,2005,2004,2003,2002,2001,2000,1999,1998,1997,1996,1995,1994,1993,1992,1991,1990,1989,1988,1987,1986,1985,1984,1983,1982,1981,1980,1979,1978,1977,1976,1975,1974,1973,1972,1971,1970,1969,1968,1967,1966,1965,1964,1963,1962,1961
Estas estatísticas em outros países:
AfghanistanAlbaniaAlgeriaAmerican SamoaAndorraAngolaAntigua and BarbudaArab WorldArgentinaArmeniaArubaAustraliaAustriaAzerbaijanBahamas, TheBahrainBangladeshBarbadosBelarusBelgiumBelizeBeninBermudaBhutanBoliviaBosnia and HerzegovinaBotswanaBrazilBritish Virgin IslandsBrunei DarussalamBulgariaBurkina FasoBurundiCabo VerdeCambodiaCameroonCanadaCaribbean small statesCayman IslandsCentral African RepublicCentral Europe and the BalticsChadChannel IslandsChileChinaColombiaComorosCongo, Dem. Rep.Congo, Rep.Costa RicaCote d'IvoireCroatiaCubaCuracaoCyprusCzech RepublicDenmarkDjiboutiDominicaDominican RepublicEarly-demographic dividendEast Asia & PacificEast Asia & Pacific (excluding high income)East Asia & Pacific (IDA & IBRD countries)EcuadorEgypt, Arab Rep.El SalvadorEquatorial GuineaEritreaEstoniaEthiopiaEuro areaEurope & Central AsiaEurope & Central Asia (excluding high income)Europe & Central Asia (IDA & IBRD countries)European UnionFaroe IslandsFijiFinlandFragile and conflict affected situationsFranceFrench PolynesiaGabonGambia, TheGeorgiaGermanyGhanaGibraltarGreeceGreenlandGrenadaGuamGuatemalaGuineaGuinea-BissauGuyanaHaitiHeavily indebted poor countries (HIPC)High incomeHondurasHong Kong SAR, ChinaHungaryIBRD onlyIcelandIDA & IBRD totalIDA blendIDA onlyIDA totalIndiaIndonesiaIran, Islamic Rep.IraqIrelandIsle of ManIsraelItalyJamaicaJapanJordanKazakhstanKenyaKiribatiKorea, Dem. People’s Rep.Korea, Rep.KuwaitKyrgyz RepublicLao PDRLate-demographic dividendLatin America & Caribbean Latin America & Caribbean (excluding high income)Latin America & the Caribbean (IDA & IBRD countries)LatviaLeast developed countries: UN classificationLebanonLesothoLiberiaLibyaLiechtensteinLithuaniaLow & middle incomeLow incomeLower middle incomeLuxembourgMacao SAR, ChinaMacedonia, FYRMadagascarMalawiMalaysiaMaldivesMaliMaltaMarshall IslandsMauritaniaMauritiusMexicoMicronesia, Fed. Sts.Middle East & North AfricaMiddle East & North Africa (excluding high income)Middle East & North Africa (IDA & IBRD countries)Middle incomeMoldovaMonacoMongoliaMontenegroMoroccoMozambiqueMyanmarNamibiaNauruNepalNetherlandsNew CaledoniaNew ZealandNicaraguaNigerNigeriaNorth AmericaNorthern Mariana IslandsNorwayOECD membersOmanOther small statesPacific island small statesPakistanPalauPanamaPapua New GuineaParaguayPeruPhilippinesPolandPortugalPost-demographic dividendPre-demographic dividendPuerto RicoQatarRomaniaRussian FederationRwandaSamoaSan MarinoSao Tome and PrincipeSaudi ArabiaSenegalSerbiaSeychellesSierra LeoneSingaporeSint Maarten (Dutch part)Slovak RepublicSloveniaSmall statesSolomon IslandsSomaliaSouth AfricaSouth AsiaSouth Asia (IDA & IBRD)South SudanSpainSri LankaSt. Kitts and NevisSt. LuciaSt. Vincent and the GrenadinesSub-Saharan Africa Sub-Saharan Africa (excluding high income)Sub-Saharan Africa (IDA & IBRD countries)SudanSurinameSwazilandSwedenSwitzerlandSyrian Arab RepublicTajikistanTanzaniaThailandTimor-LesteTogoTongaTrinidad and TobagoTunisiaTurkeyTurkmenistanTurks and Caicos IslandsTuvaluUgandaUkraineUnited Arab EmiratesUnited KingdomUnited StatesUpper middle incomeUruguayUzbekistanVanuatuVenezuela, RBVietnamVirgin Islands (U.S.)West Bank and GazaWorldYemen, Rep.ZambiaZimbabwe Linha do tempo:
Nesta escala de tempo está apresentado um gráfico de 1961 ano até 2016 ano Vietnam. Dados de 1960 ano ausente. O número de observações reais por data: 56.
Fonte (nome):
Indicadores de desenvolvimento mundial
Fonte (organização):
World Bank Staff estimates based on United Nations, World Urbanization Prospects.
Categorias:
Climate Change, Urban Development
Foi atualizado:
23 abr 2017 ano
Indicadores de alterações dos valores ao longo dos anos
Mínimo:
2.048
1 jan 1984 ano
Máximo:
4.411
1 jan 1971 ano
Na data de observação
Valor
Mudança absoluta
A alteração em relação ao valor anterior
1 jan 1961 ano
3.938
+3.938
0.0%
1 jan 1962 ano
4.179
+0.241
6.13%
1 jan 1963 ano
4.167
-0.013
-0.3%
1 jan 1964 ano
4.175
+0.008
0.19%
1 jan 1965 ano
4.187
+0.012
0.29%
1 jan 1966 ano
4.219
+0.032
0.77%
1 jan 1967 ano
4.254
+0.035
0.84%
1 jan 1968 ano
4.293
+0.039
0.91%
1 jan 1969 ano
4.336
+0.043
1.0%
1 jan 1970 ano
4.375
+0.04
0.92%
1 jan 1971 ano
4.411
+0.036
0.82%
1 jan 1972 ano
2.827
-1.584
-35.91%
1 jan 1973 ano
2.856
+0.028
0.99%
1 jan 1974 ano
2.874
+0.018
0.64%
1 jan 1975 ano
2.878
+0.004
0.13%
1 jan 1976 ano
2.86
-0.017
-0.6%
1 jan 1977 ano
2.842
-0.018
-0.65%
1 jan 1978 ano
2.804
-0.037
-1.32%
1 jan 1979 ano
2.758
-0.046
-1.64%
1 jan 1980 ano
2.706
-0.052
-1.9%
1 jan 1981 ano
2.494
-0.212
-7.84%
1 jan 1982 ano
2.207
-0.287
-11.51%
1 jan 1983 ano
2.074
-0.133
-6.03%
1 jan 1984 ano
2.048
-0.026
-1.24%
1 jan 1985 ano
2.137
+0.089
4.37%
1 jan 1986 ano
2.34
+0.203
9.5%
1 jan 1987 ano
2.645
+0.305
13.03%
1 jan 1988 ano
2.781
+0.136
5.13%
1 jan 1989 ano
2.745
-0.036
-1.3%
1 jan 1990 ano
3.057
+0.311
11.34%
1 jan 1991 ano
3.719
+0.662
21.66%
1 jan 1992 ano
3.65
-0.069
-1.85%
1 jan 1993 ano
3.582
-0.068
-1.86%
1 jan 1994 ano
3.603
+0.021
0.58%
1 jan 1995 ano
3.546
-0.057
-1.57%
1 jan 1996 ano
3.4
-0.147
-4.13%
1 jan 1997 ano
3.351
-0.048
-1.42%
1 jan 1998 ano
3.294
-0.057
-1.7%
1 jan 1999 ano
3.27
-0.025
-0.75%
1 jan 2000 ano
3.369
+0.099
3.04%
1 jan 2001 ano
3.653
+0.284
8.43%
1 jan 2002 ano
3.55
-0.103
-2.81%
1 jan 2003 ano
3.436
-0.115
-3.23%
1 jan 2004 ano
3.414
-0.022
-0.63%
1 jan 2005 ano
3.437
+0.023
0.67%
1 jan 2006 ano
3.383
-0.054
-1.56%
1 jan 2007 ano
3.31
-0.073
-2.16%
1 jan 2008 ano
3.268
-0.042
-1.27%
1 jan 2009 ano
3.229
-0.039
-1.2%
1 jan 2010 ano
3.199
-0.03
-0.92%
1 jan 2011 ano
3.158
-0.041
-1.29%
1 jan 2012 ano
3.136
-0.022
-0.69%
1 jan 2013 ano
3.113
-0.023
-0.74%
1 jan 2014 ano
3.068
-0.044
-1.43%
1 jan 2015 ano
3.042
-0.026
-0.86%
1 jan 2016 ano
2.998
-0.043
-1.43%
Classificação de países por estatísticas atuais por anos


Comentários: