29
/pt/
pt
AIzaSyAYiBZKx7MnpbEhh9jyipgxe19OcubqV5w
April 1, 2024
288060
Zimbabwe
ZWE
true
2
1
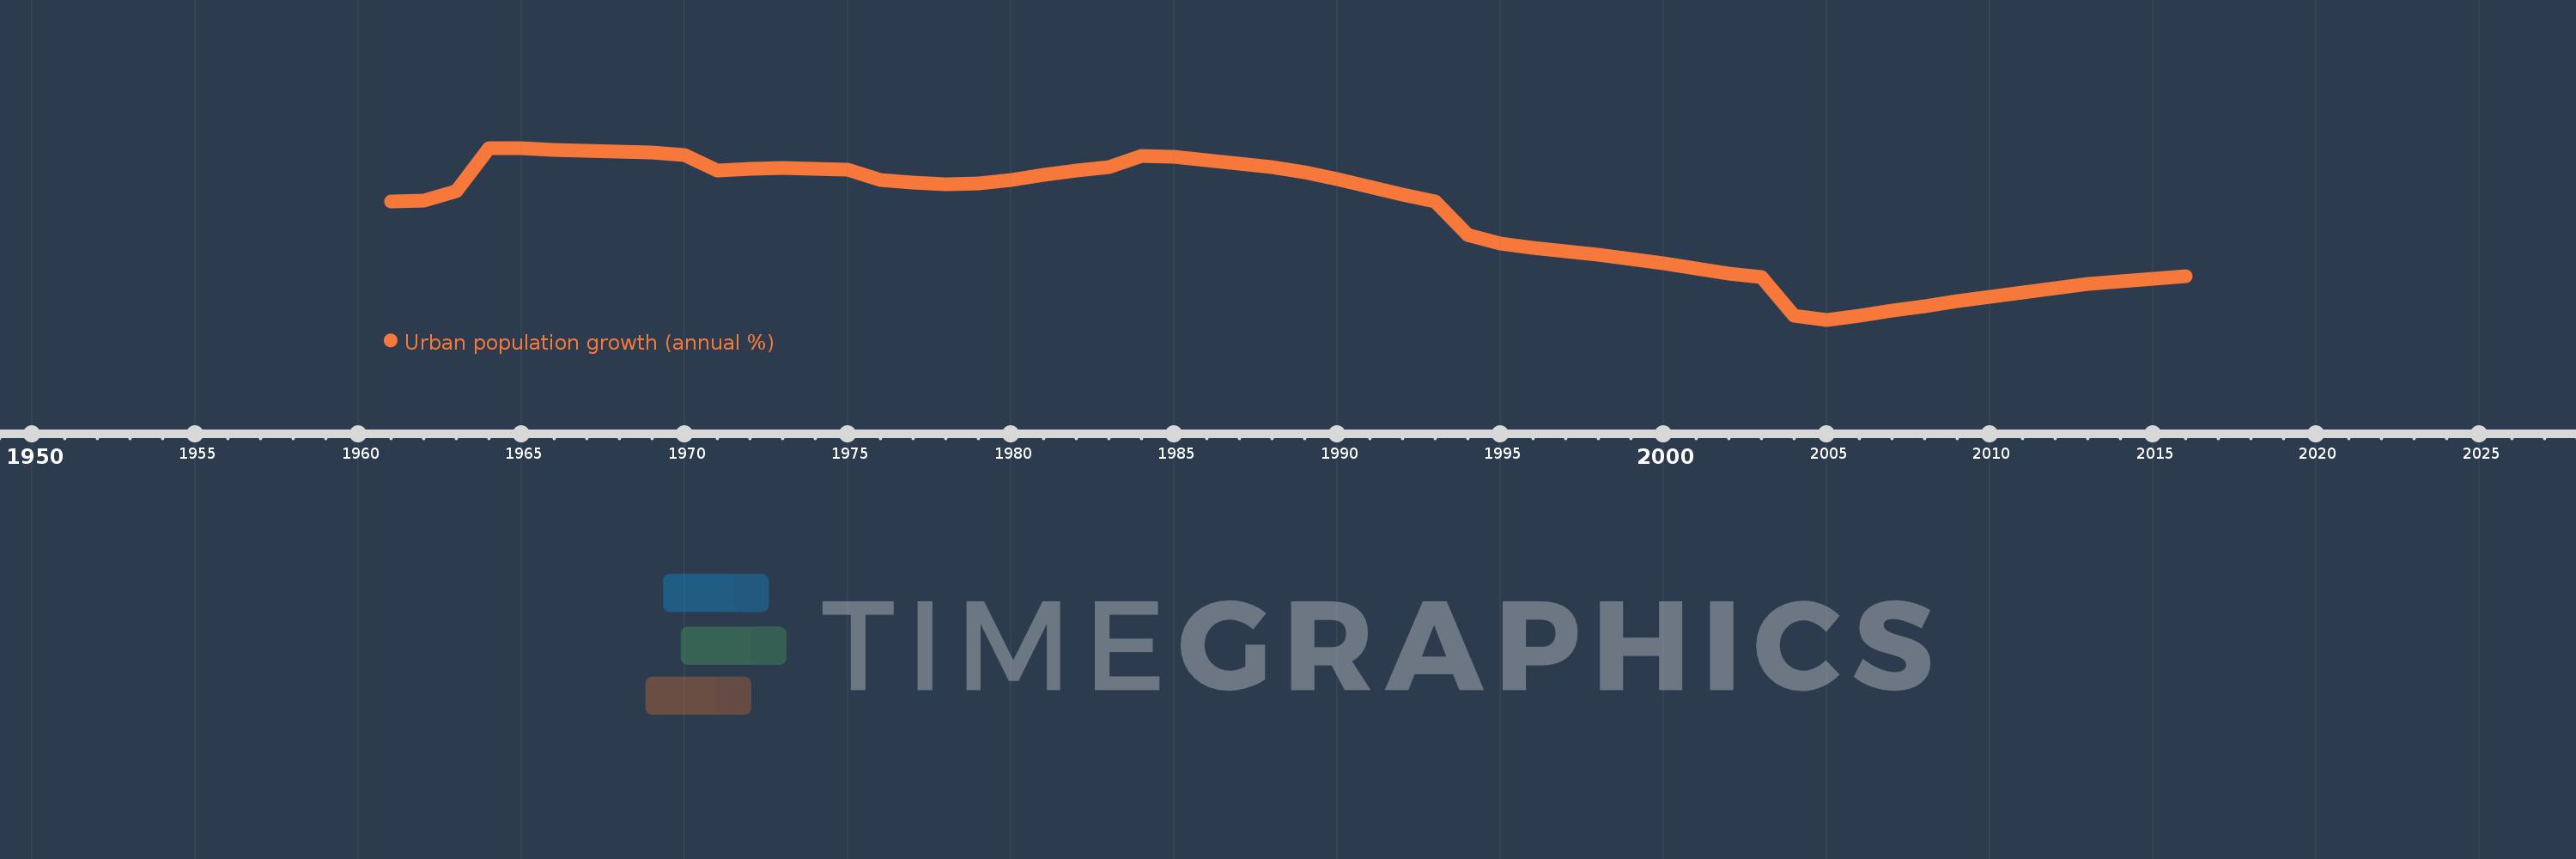
Urban population growth (annual %)
2016,2015,2014,2013,2012,2011,2010,2009,2008,2007,2006,2005,2004,2003,2002,2001,2000,1999,1998,1997,1996,1995,1994,1993,1992,1991,1990,1989,1988,1987,1986,1985,1984,1983,1982,1981,1980,1979,1978,1977,1976,1975,1974,1973,1972,1971,1970,1969,1968,1967,1966,1965,1964,1963,1962,1961
Estas estatísticas em outros países:
AfghanistanAlbaniaAlgeriaAmerican SamoaAndorraAngolaAntigua and BarbudaArab WorldArgentinaArmeniaArubaAustraliaAustriaAzerbaijanBahamas, TheBahrainBangladeshBarbadosBelarusBelgiumBelizeBeninBermudaBhutanBoliviaBosnia and HerzegovinaBotswanaBrazilBritish Virgin IslandsBrunei DarussalamBulgariaBurkina FasoBurundiCabo VerdeCambodiaCameroonCanadaCaribbean small statesCayman IslandsCentral African RepublicCentral Europe and the BalticsChadChannel IslandsChileChinaColombiaComorosCongo, Dem. Rep.Congo, Rep.Costa RicaCote d'IvoireCroatiaCubaCuracaoCyprusCzech RepublicDenmarkDjiboutiDominicaDominican RepublicEarly-demographic dividendEast Asia & PacificEast Asia & Pacific (excluding high income)East Asia & Pacific (IDA & IBRD countries)EcuadorEgypt, Arab Rep.El SalvadorEquatorial GuineaEritreaEstoniaEthiopiaEuro areaEurope & Central AsiaEurope & Central Asia (excluding high income)Europe & Central Asia (IDA & IBRD countries)European UnionFaroe IslandsFijiFinlandFragile and conflict affected situationsFranceFrench PolynesiaGabonGambia, TheGeorgiaGermanyGhanaGibraltarGreeceGreenlandGrenadaGuamGuatemalaGuineaGuinea-BissauGuyanaHaitiHeavily indebted poor countries (HIPC)High incomeHondurasHong Kong SAR, ChinaHungaryIBRD onlyIcelandIDA & IBRD totalIDA blendIDA onlyIDA totalIndiaIndonesiaIran, Islamic Rep.IraqIrelandIsle of ManIsraelItalyJamaicaJapanJordanKazakhstanKenyaKiribatiKorea, Dem. People’s Rep.Korea, Rep.KuwaitKyrgyz RepublicLao PDRLate-demographic dividendLatin America & Caribbean Latin America & Caribbean (excluding high income)Latin America & the Caribbean (IDA & IBRD countries)LatviaLeast developed countries: UN classificationLebanonLesothoLiberiaLibyaLiechtensteinLithuaniaLow & middle incomeLow incomeLower middle incomeLuxembourgMacao SAR, ChinaMacedonia, FYRMadagascarMalawiMalaysiaMaldivesMaliMaltaMarshall IslandsMauritaniaMauritiusMexicoMicronesia, Fed. Sts.Middle East & North AfricaMiddle East & North Africa (excluding high income)Middle East & North Africa (IDA & IBRD countries)Middle incomeMoldovaMonacoMongoliaMontenegroMoroccoMozambiqueMyanmarNamibiaNauruNepalNetherlandsNew CaledoniaNew ZealandNicaraguaNigerNigeriaNorth AmericaNorthern Mariana IslandsNorwayOECD membersOmanOther small statesPacific island small statesPakistanPalauPanamaPapua New GuineaParaguayPeruPhilippinesPolandPortugalPost-demographic dividendPre-demographic dividendPuerto RicoQatarRomaniaRussian FederationRwandaSamoaSan MarinoSao Tome and PrincipeSaudi ArabiaSenegalSerbiaSeychellesSierra LeoneSingaporeSint Maarten (Dutch part)Slovak RepublicSloveniaSmall statesSolomon IslandsSomaliaSouth AfricaSouth AsiaSouth Asia (IDA & IBRD)South SudanSpainSri LankaSt. Kitts and NevisSt. LuciaSt. Vincent and the GrenadinesSub-Saharan Africa Sub-Saharan Africa (excluding high income)Sub-Saharan Africa (IDA & IBRD countries)SudanSurinameSwazilandSwedenSwitzerlandSyrian Arab RepublicTajikistanTanzaniaThailandTimor-LesteTogoTongaTrinidad and TobagoTunisiaTurkeyTurkmenistanTurks and Caicos IslandsTuvaluUgandaUkraineUnited Arab EmiratesUnited KingdomUnited StatesUpper middle incomeUruguayUzbekistanVanuatuVenezuela, RBVietnamVirgin Islands (U.S.)West Bank and GazaWorldYemen, Rep.ZambiaZimbabwe Linha do tempo:
Nesta escala de tempo está apresentado um gráfico de 1961 ano até 2016 ano Zimbabwe. Dados de 1960 ano ausente. O número de observações reais por data: 56.
Fonte (nome):
Indicadores de desenvolvimento mundial
Fonte (organização):
World Bank Staff estimates based on United Nations, World Urbanization Prospects.
Categorias:
Climate Change, Urban Development
Foi atualizado:
23 abr 2017 ano
Indicadores de alterações dos valores ao longo dos anos
Mínimo:
0.193
1 jan 2005 ano
Máximo:
7.024
1 jan 1964 ano
Na data de observação
Valor
Mudança absoluta
A alteração em relação ao valor anterior
1 jan 1961 ano
4.898
+4.898
0.0%
1 jan 1962 ano
4.933
+0.035
0.72%
1 jan 1963 ano
5.304
+0.371
7.53%
1 jan 1964 ano
7.024
+1.72
32.43%
1 jan 1965 ano
7.012
-0.013
-0.18%
1 jan 1966 ano
6.955
-0.056
-0.8%
1 jan 1967 ano
6.912
-0.043
-0.62%
1 jan 1968 ano
6.876
-0.037
-0.53%
1 jan 1969 ano
6.858
-0.018
-0.26%
1 jan 1970 ano
6.733
-0.124
-1.81%
1 jan 1971 ano
6.135
-0.598
-8.89%
1 jan 1972 ano
6.181
+0.046
0.75%
1 jan 1973 ano
6.22
+0.039
0.63%
1 jan 1974 ano
6.201
-0.019
-0.3%
1 jan 1975 ano
6.149
-0.053
-0.85%
1 jan 1976 ano
5.745
-0.404
-6.57%
1 jan 1977 ano
5.649
-0.096
-1.67%
1 jan 1978 ano
5.571
-0.077
-1.37%
1 jan 1979 ano
5.598
+0.027
0.48%
1 jan 1980 ano
5.74
+0.142
2.53%
1 jan 1981 ano
5.945
+0.205
3.58%
1 jan 1982 ano
6.123
+0.177
2.98%
1 jan 1983 ano
6.248
+0.125
2.04%
1 jan 1984 ano
6.691
+0.444
7.1%
1 jan 1985 ano
6.689
-0.002
-0.04%
1 jan 1986 ano
6.549
-0.14
-2.1%
1 jan 1987 ano
6.407
-0.142
-2.17%
1 jan 1988 ano
6.257
-0.15
-2.34%
1 jan 1989 ano
6.046
-0.211
-3.38%
1 jan 1990 ano
5.777
-0.268
-4.43%
1 jan 1991 ano
5.48
-0.298
-5.15%
1 jan 1992 ano
5.174
-0.306
-5.59%
1 jan 1993 ano
4.884
-0.29
-5.61%
1 jan 1994 ano
3.562
-1.322
-27.07%
1 jan 1995 ano
3.207
-0.355
-9.97%
1 jan 1996 ano
3.041
-0.166
-5.17%
1 jan 1997 ano
2.904
-0.137
-4.5%
1 jan 1998 ano
2.766
-0.138
-4.77%
1 jan 1999 ano
2.611
-0.154
-5.57%
1 jan 2000 ano
2.428
-0.183
-7.01%
1 jan 2001 ano
2.238
-0.191
-7.85%
1 jan 2002 ano
2.042
-0.196
-8.76%
1 jan 2003 ano
1.899
-0.143
-7.01%
1 jan 2004 ano
0.343
-1.556
-81.94%
1 jan 2005 ano
0.193
-0.15
-43.82%
1 jan 2006 ano
0.364
+0.171
89.01%
1 jan 2007 ano
0.558
+0.194
53.41%
1 jan 2008 ano
0.745
+0.186
33.36%
1 jan 2009 ano
0.932
+0.187
25.11%
1 jan 2010 ano
1.114
+0.182
19.52%
1 jan 2011 ano
1.28
+0.166
14.91%
1 jan 2012 ano
1.449
+0.169
13.24%
1 jan 2013 ano
1.601
+0.152
10.47%
1 jan 2014 ano
1.708
+0.107
6.71%
1 jan 2015 ano
1.838
+0.13
7.59%
1 jan 2016 ano
1.929
+0.091
4.94%
Classificação de países por estatísticas atuais por anos


Comentários: