29
/pt/
pt
AIzaSyAYiBZKx7MnpbEhh9jyipgxe19OcubqV5w
April 1, 2024
196431
Mexico
MEX
true
2
1
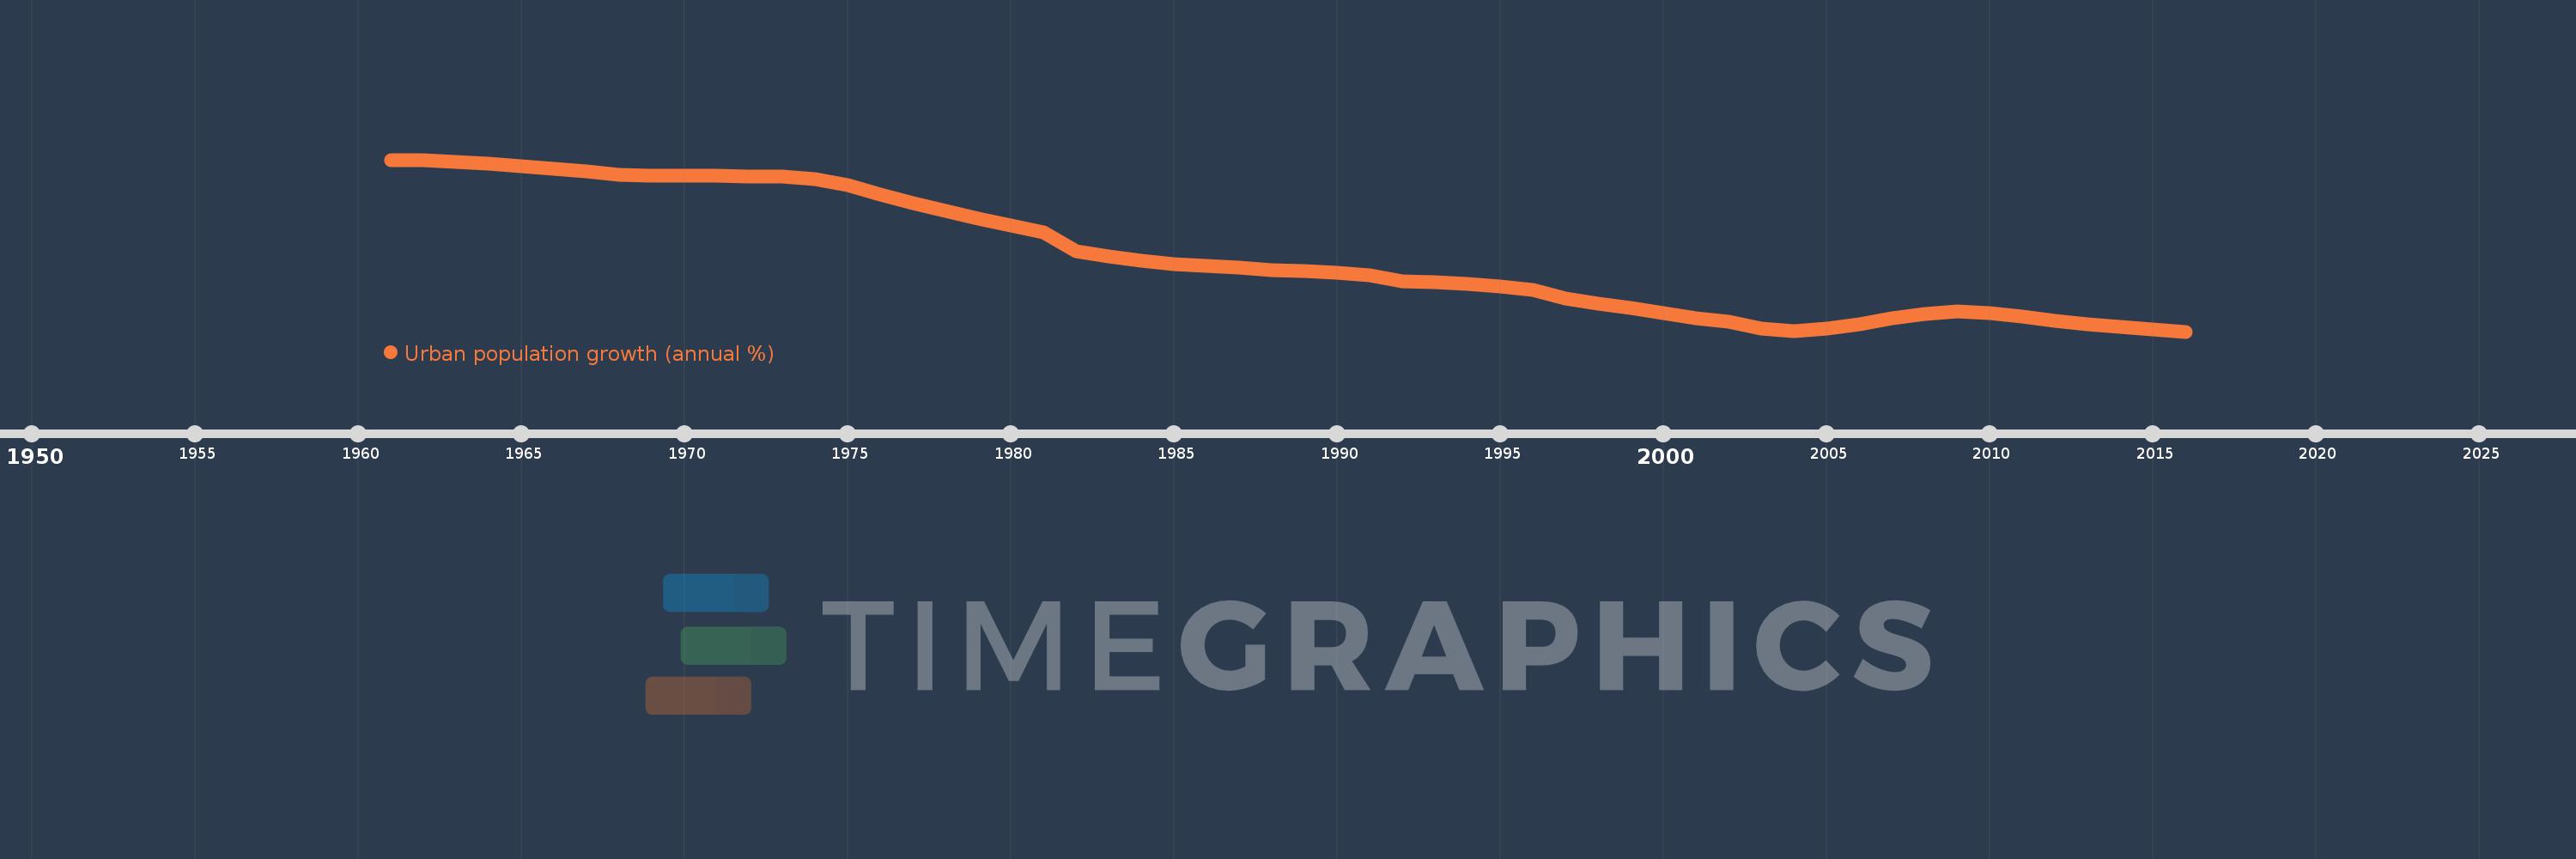
Urban population growth (annual %)
2016,2015,2014,2013,2012,2011,2010,2009,2008,2007,2006,2005,2004,2003,2002,2001,2000,1999,1998,1997,1996,1995,1994,1993,1992,1991,1990,1989,1988,1987,1986,1985,1984,1983,1982,1981,1980,1979,1978,1977,1976,1975,1974,1973,1972,1971,1970,1969,1968,1967,1966,1965,1964,1963,1962,1961
Estas estatísticas em outros países:
AfghanistanAlbaniaAlgeriaAmerican SamoaAndorraAngolaAntigua and BarbudaArab WorldArgentinaArmeniaArubaAustraliaAustriaAzerbaijanBahamas, TheBahrainBangladeshBarbadosBelarusBelgiumBelizeBeninBermudaBhutanBoliviaBosnia and HerzegovinaBotswanaBrazilBritish Virgin IslandsBrunei DarussalamBulgariaBurkina FasoBurundiCabo VerdeCambodiaCameroonCanadaCaribbean small statesCayman IslandsCentral African RepublicCentral Europe and the BalticsChadChannel IslandsChileChinaColombiaComorosCongo, Dem. Rep.Congo, Rep.Costa RicaCote d'IvoireCroatiaCubaCuracaoCyprusCzech RepublicDenmarkDjiboutiDominicaDominican RepublicEarly-demographic dividendEast Asia & PacificEast Asia & Pacific (excluding high income)East Asia & Pacific (IDA & IBRD countries)EcuadorEgypt, Arab Rep.El SalvadorEquatorial GuineaEritreaEstoniaEthiopiaEuro areaEurope & Central AsiaEurope & Central Asia (excluding high income)Europe & Central Asia (IDA & IBRD countries)European UnionFaroe IslandsFijiFinlandFragile and conflict affected situationsFranceFrench PolynesiaGabonGambia, TheGeorgiaGermanyGhanaGibraltarGreeceGreenlandGrenadaGuamGuatemalaGuineaGuinea-BissauGuyanaHaitiHeavily indebted poor countries (HIPC)High incomeHondurasHong Kong SAR, ChinaHungaryIBRD onlyIcelandIDA & IBRD totalIDA blendIDA onlyIDA totalIndiaIndonesiaIran, Islamic Rep.IraqIrelandIsle of ManIsraelItalyJamaicaJapanJordanKazakhstanKenyaKiribatiKorea, Dem. People’s Rep.Korea, Rep.KuwaitKyrgyz RepublicLao PDRLate-demographic dividendLatin America & Caribbean Latin America & Caribbean (excluding high income)Latin America & the Caribbean (IDA & IBRD countries)LatviaLeast developed countries: UN classificationLebanonLesothoLiberiaLibyaLiechtensteinLithuaniaLow & middle incomeLow incomeLower middle incomeLuxembourgMacao SAR, ChinaMacedonia, FYRMadagascarMalawiMalaysiaMaldivesMaliMaltaMarshall IslandsMauritaniaMauritiusMexicoMicronesia, Fed. Sts.Middle East & North AfricaMiddle East & North Africa (excluding high income)Middle East & North Africa (IDA & IBRD countries)Middle incomeMoldovaMonacoMongoliaMontenegroMoroccoMozambiqueMyanmarNamibiaNauruNepalNetherlandsNew CaledoniaNew ZealandNicaraguaNigerNigeriaNorth AmericaNorthern Mariana IslandsNorwayOECD membersOmanOther small statesPacific island small statesPakistanPalauPanamaPapua New GuineaParaguayPeruPhilippinesPolandPortugalPost-demographic dividendPre-demographic dividendPuerto RicoQatarRomaniaRussian FederationRwandaSamoaSan MarinoSao Tome and PrincipeSaudi ArabiaSenegalSerbiaSeychellesSierra LeoneSingaporeSint Maarten (Dutch part)Slovak RepublicSloveniaSmall statesSolomon IslandsSomaliaSouth AfricaSouth AsiaSouth Asia (IDA & IBRD)South SudanSpainSri LankaSt. Kitts and NevisSt. LuciaSt. Vincent and the GrenadinesSub-Saharan Africa Sub-Saharan Africa (excluding high income)Sub-Saharan Africa (IDA & IBRD countries)SudanSurinameSwazilandSwedenSwitzerlandSyrian Arab RepublicTajikistanTanzaniaThailandTimor-LesteTogoTongaTrinidad and TobagoTunisiaTurkeyTurkmenistanTurks and Caicos IslandsTuvaluUgandaUkraineUnited Arab EmiratesUnited KingdomUnited StatesUpper middle incomeUruguayUzbekistanVanuatuVenezuela, RBVietnamVirgin Islands (U.S.)West Bank and GazaWorldYemen, Rep.ZambiaZimbabwe Linha do tempo:
Nesta escala de tempo está apresentado um gráfico de 1961 ano até 2016 ano Mexico. Dados de 1960 ano ausente. O número de observações reais por data: 56.
Fonte (nome):
Indicadores de desenvolvimento mundial
Fonte (organização):
World Bank Staff estimates based on United Nations, World Urbanization Prospects.
Categorias:
Climate Change, Urban Development
Foi atualizado:
23 abr 2017 ano
Indicadores de alterações dos valores ao longo dos anos
Mínimo:
1.64
1 jan 2016 ano
Máximo:
4.782
1 jan 1962 ano
Na data de observação
Valor
Mudança absoluta
A alteração em relação ao valor anterior
1 jan 1961 ano
4.777
+4.777
0.0%
1 jan 1962 ano
4.782
+0.005
0.1%
1 jan 1963 ano
4.749
-0.033
-0.69%
1 jan 1964 ano
4.709
-0.04
-0.84%
1 jan 1965 ano
4.664
-0.044
-0.94%
1 jan 1966 ano
4.617
-0.048
-1.02%
1 jan 1967 ano
4.563
-0.054
-1.17%
1 jan 1968 ano
4.507
-0.056
-1.22%
1 jan 1969 ano
4.486
-0.021
-0.47%
1 jan 1970 ano
4.495
+0.009
0.21%
1 jan 1971 ano
4.488
-0.007
-0.16%
1 jan 1972 ano
4.472
-0.016
-0.35%
1 jan 1973 ano
4.477
+0.005
0.1%
1 jan 1974 ano
4.425
-0.052
-1.15%
1 jan 1975 ano
4.311
-0.114
-2.57%
1 jan 1976 ano
4.152
-0.159
-3.69%
1 jan 1977 ano
3.99
-0.162
-3.9%
1 jan 1978 ano
3.84
-0.15
-3.77%
1 jan 1979 ano
3.703
-0.137
-3.56%
1 jan 1980 ano
3.578
-0.125
-3.38%
1 jan 1981 ano
3.448
-0.13
-3.64%
1 jan 1982 ano
3.107
-0.341
-9.89%
1 jan 1983 ano
3.01
-0.097
-3.12%
1 jan 1984 ano
2.935
-0.075
-2.49%
1 jan 1985 ano
2.879
-0.056
-1.9%
1 jan 1986 ano
2.84
-0.039
-1.37%
1 jan 1987 ano
2.805
-0.035
-1.22%
1 jan 1988 ano
2.769
-0.036
-1.29%
1 jan 1989 ano
2.74
-0.028
-1.03%
1 jan 1990 ano
2.719
-0.021
-0.77%
1 jan 1991 ano
2.665
-0.054
-1.99%
1 jan 1992 ano
2.564
-0.101
-3.81%
1 jan 1993 ano
2.544
-0.02
-0.78%
1 jan 1994 ano
2.512
-0.032
-1.26%
1 jan 1995 ano
2.467
-0.044
-1.77%
1 jan 1996 ano
2.408
-0.059
-2.39%
1 jan 1997 ano
2.252
-0.156
-6.49%
1 jan 1998 ano
2.148
-0.104
-4.62%
1 jan 1999 ano
2.075
-0.073
-3.42%
1 jan 2000 ano
1.97
-0.105
-5.04%
1 jan 2001 ano
1.888
-0.082
-4.17%
1 jan 2002 ano
1.814
-0.074
-3.94%
1 jan 2003 ano
1.702
-0.112
-6.18%
1 jan 2004 ano
1.653
-0.049
-2.86%
1 jan 2005 ano
1.688
+0.035
2.14%
1 jan 2006 ano
1.775
+0.087
5.16%
1 jan 2007 ano
1.883
+0.107
6.05%
1 jan 2008 ano
1.963
+0.08
4.27%
1 jan 2009 ano
2.002
+0.039
1.97%
1 jan 2010 ano
1.978
-0.024
-1.21%
1 jan 2011 ano
1.914
-0.063
-3.21%
1 jan 2012 ano
1.838
-0.076
-3.97%
1 jan 2013 ano
1.776
-0.062
-3.37%
1 jan 2014 ano
1.72
-0.057
-3.2%
1 jan 2015 ano
1.676
-0.043
-2.51%
1 jan 2016 ano
1.64
-0.036
-2.15%
Classificação de países por estatísticas atuais por anos


Comentários: