29
/pt/
pt
AIzaSyAYiBZKx7MnpbEhh9jyipgxe19OcubqV5w
April 1, 2024
192038
Malta
MLT
true
2
1
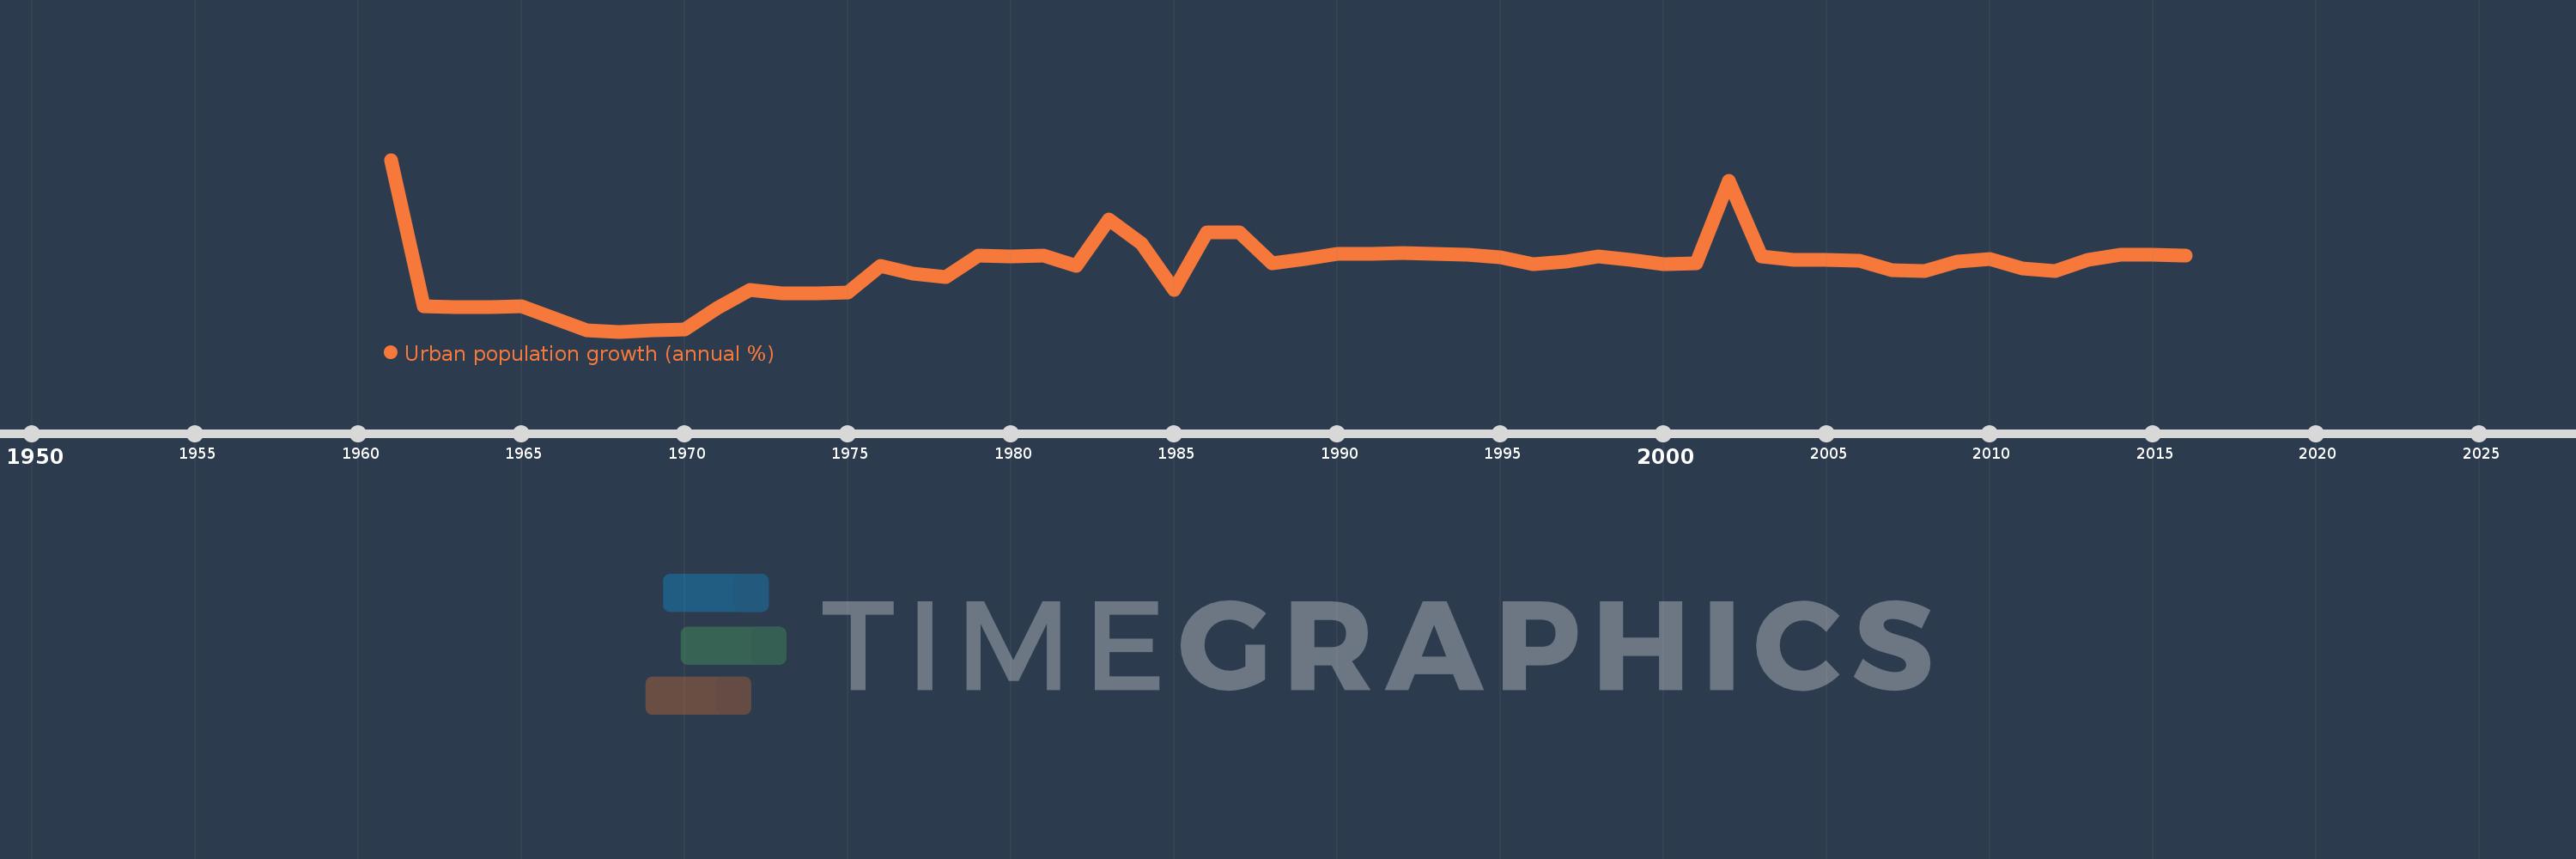
Urban population growth (annual %)
2016,2015,2014,2013,2012,2011,2010,2009,2008,2007,2006,2005,2004,2003,2002,2001,2000,1999,1998,1997,1996,1995,1994,1993,1992,1991,1990,1989,1988,1987,1986,1985,1984,1983,1982,1981,1980,1979,1978,1977,1976,1975,1974,1973,1972,1971,1970,1969,1968,1967,1966,1965,1964,1963,1962,1961
Estas estatísticas em outros países:
AfghanistanAlbaniaAlgeriaAmerican SamoaAndorraAngolaAntigua and BarbudaArab WorldArgentinaArmeniaArubaAustraliaAustriaAzerbaijanBahamas, TheBahrainBangladeshBarbadosBelarusBelgiumBelizeBeninBermudaBhutanBoliviaBosnia and HerzegovinaBotswanaBrazilBritish Virgin IslandsBrunei DarussalamBulgariaBurkina FasoBurundiCabo VerdeCambodiaCameroonCanadaCaribbean small statesCayman IslandsCentral African RepublicCentral Europe and the BalticsChadChannel IslandsChileChinaColombiaComorosCongo, Dem. Rep.Congo, Rep.Costa RicaCote d'IvoireCroatiaCubaCuracaoCyprusCzech RepublicDenmarkDjiboutiDominicaDominican RepublicEarly-demographic dividendEast Asia & PacificEast Asia & Pacific (excluding high income)East Asia & Pacific (IDA & IBRD countries)EcuadorEgypt, Arab Rep.El SalvadorEquatorial GuineaEritreaEstoniaEthiopiaEuro areaEurope & Central AsiaEurope & Central Asia (excluding high income)Europe & Central Asia (IDA & IBRD countries)European UnionFaroe IslandsFijiFinlandFragile and conflict affected situationsFranceFrench PolynesiaGabonGambia, TheGeorgiaGermanyGhanaGibraltarGreeceGreenlandGrenadaGuamGuatemalaGuineaGuinea-BissauGuyanaHaitiHeavily indebted poor countries (HIPC)High incomeHondurasHong Kong SAR, ChinaHungaryIBRD onlyIcelandIDA & IBRD totalIDA blendIDA onlyIDA totalIndiaIndonesiaIran, Islamic Rep.IraqIrelandIsle of ManIsraelItalyJamaicaJapanJordanKazakhstanKenyaKiribatiKorea, Dem. People’s Rep.Korea, Rep.KuwaitKyrgyz RepublicLao PDRLate-demographic dividendLatin America & Caribbean Latin America & Caribbean (excluding high income)Latin America & the Caribbean (IDA & IBRD countries)LatviaLeast developed countries: UN classificationLebanonLesothoLiberiaLibyaLiechtensteinLithuaniaLow & middle incomeLow incomeLower middle incomeLuxembourgMacao SAR, ChinaMacedonia, FYRMadagascarMalawiMalaysiaMaldivesMaliMaltaMarshall IslandsMauritaniaMauritiusMexicoMicronesia, Fed. Sts.Middle East & North AfricaMiddle East & North Africa (excluding high income)Middle East & North Africa (IDA & IBRD countries)Middle incomeMoldovaMonacoMongoliaMontenegroMoroccoMozambiqueMyanmarNamibiaNauruNepalNetherlandsNew CaledoniaNew ZealandNicaraguaNigerNigeriaNorth AmericaNorthern Mariana IslandsNorwayOECD membersOmanOther small statesPacific island small statesPakistanPalauPanamaPapua New GuineaParaguayPeruPhilippinesPolandPortugalPost-demographic dividendPre-demographic dividendPuerto RicoQatarRomaniaRussian FederationRwandaSamoaSan MarinoSao Tome and PrincipeSaudi ArabiaSenegalSerbiaSeychellesSierra LeoneSingaporeSint Maarten (Dutch part)Slovak RepublicSloveniaSmall statesSolomon IslandsSomaliaSouth AfricaSouth AsiaSouth Asia (IDA & IBRD)South SudanSpainSri LankaSt. Kitts and NevisSt. LuciaSt. Vincent and the GrenadinesSub-Saharan Africa Sub-Saharan Africa (excluding high income)Sub-Saharan Africa (IDA & IBRD countries)SudanSurinameSwazilandSwedenSwitzerlandSyrian Arab RepublicTajikistanTanzaniaThailandTimor-LesteTogoTongaTrinidad and TobagoTunisiaTurkeyTurkmenistanTurks and Caicos IslandsTuvaluUgandaUkraineUnited Arab EmiratesUnited KingdomUnited StatesUpper middle incomeUruguayUzbekistanVanuatuVenezuela, RBVietnamVirgin Islands (U.S.)West Bank and GazaWorldYemen, Rep.ZambiaZimbabwe Linha do tempo:
Nesta escala de tempo está apresentado um gráfico de 1961 ano até 2016 ano Malta. Dados de 1960 ano ausente. O número de observações reais por data: 56.
Fonte (nome):
Indicadores de desenvolvimento mundial
Fonte (organização):
World Bank Staff estimates based on United Nations, World Urbanization Prospects.
Categorias:
Climate Change, Urban Development
Foi atualizado:
23 abr 2017 ano
Indicadores de alterações dos valores ao longo dos anos
Mínimo:
-1.234
1 jan 1968 ano
Máximo:
3.941
1 jan 1961 ano
Na data de observação
Valor
Mudança absoluta
A alteração em relação ao valor anterior
1 jan 1961 ano
3.941
+3.941
0.0%
1 jan 1962 ano
-0.466
-4.407
-111.81%
1 jan 1963 ano
-0.484
-0.018
3.86%
1 jan 1964 ano
-0.484
-0.001
0.2%
1 jan 1965 ano
-0.473
+0.012
-2.44%
1 jan 1966 ano
-0.834
-0.361
76.37%
1 jan 1967 ano
-1.204
-0.37
44.39%
1 jan 1968 ano
-1.234
-0.03
2.5%
1 jan 1969 ano
-1.201
+0.033
-2.66%
1 jan 1970 ano
-1.167
+0.034
-2.81%
1 jan 1971 ano
-0.534
+0.633
-54.26%
1 jan 1972 ano
0.027
+0.56
-104.97%
1 jan 1973 ano
-0.074
-0.1
-377.84%
1 jan 1974 ano
-0.073
+0.001
-1.43%
1 jan 1975 ano
-0.058
+0.015
-20.76%
1 jan 1976 ano
0.743
+0.801
-1.39 mil%
1 jan 1977 ano
0.519
-0.225
-30.21%
1 jan 1978 ano
0.4
-0.118
-22.82%
1 jan 1979 ano
1.05
+0.649
162.21%
1 jan 1980 ano
1.024
-0.026
-2.49%
1 jan 1981 ano
1.058
+0.034
3.32%
1 jan 1982 ano
0.745
-0.312
-29.52%
1 jan 1983 ano
2.155
+1.409
189.1%
1 jan 1984 ano
1.418
-0.736
-34.17%
1 jan 1985 ano
0.031
-1.387
-97.82%
1 jan 1986 ano
1.765
+1.735
5.6 mil%
1 jan 1987 ano
1.759
-0.007
-0.37%
1 jan 1988 ano
0.823
-0.936
-53.21%
1 jan 1989 ano
0.953
+0.13
15.8%
1 jan 1990 ano
1.104
+0.151
15.84%
1 jan 1991 ano
1.107
+0.003
0.24%
1 jan 1992 ano
1.128
+0.021
1.89%
1 jan 1993 ano
1.109
-0.019
-1.68%
1 jan 1994 ano
1.072
-0.036
-3.28%
1 jan 1995 ano
1.007
-0.065
-6.08%
1 jan 1996 ano
0.797
-0.21
-20.84%
1 jan 1997 ano
0.865
+0.068
8.48%
1 jan 1998 ano
1.022
+0.157
18.19%
1 jan 1999 ano
0.934
-0.088
-8.6%
1 jan 2000 ano
0.805
-0.129
-13.82%
1 jan 2001 ano
0.833
+0.028
3.5%
1 jan 2002 ano
3.308
+2.475
297.01%
1 jan 2003 ano
1.03
-2.278
-68.86%
1 jan 2004 ano
0.932
-0.098
-9.54%
1 jan 2005 ano
0.936
+0.004
0.48%
1 jan 2006 ano
0.892
-0.044
-4.74%
1 jan 2007 ano
0.61
-0.282
-31.63%
1 jan 2008 ano
0.58
-0.03
-4.93%
1 jan 2009 ano
0.866
+0.286
49.41%
1 jan 2010 ano
0.956
+0.09
10.4%
1 jan 2011 ano
0.68
-0.276
-28.84%
1 jan 2012 ano
0.601
-0.08
-11.69%
1 jan 2013 ano
0.929
+0.328
54.63%
1 jan 2014 ano
1.086
+0.157
16.86%
1 jan 2015 ano
1.083
-0.003
-0.26%
1 jan 2016 ano
1.061
-0.022
-2.06%
Classificação de países por estatísticas atuais por anos


Comentários: