29
/pt/
pt
AIzaSyAYiBZKx7MnpbEhh9jyipgxe19OcubqV5w
April 1, 2024
91832
Brazil
BRA
true
2
1
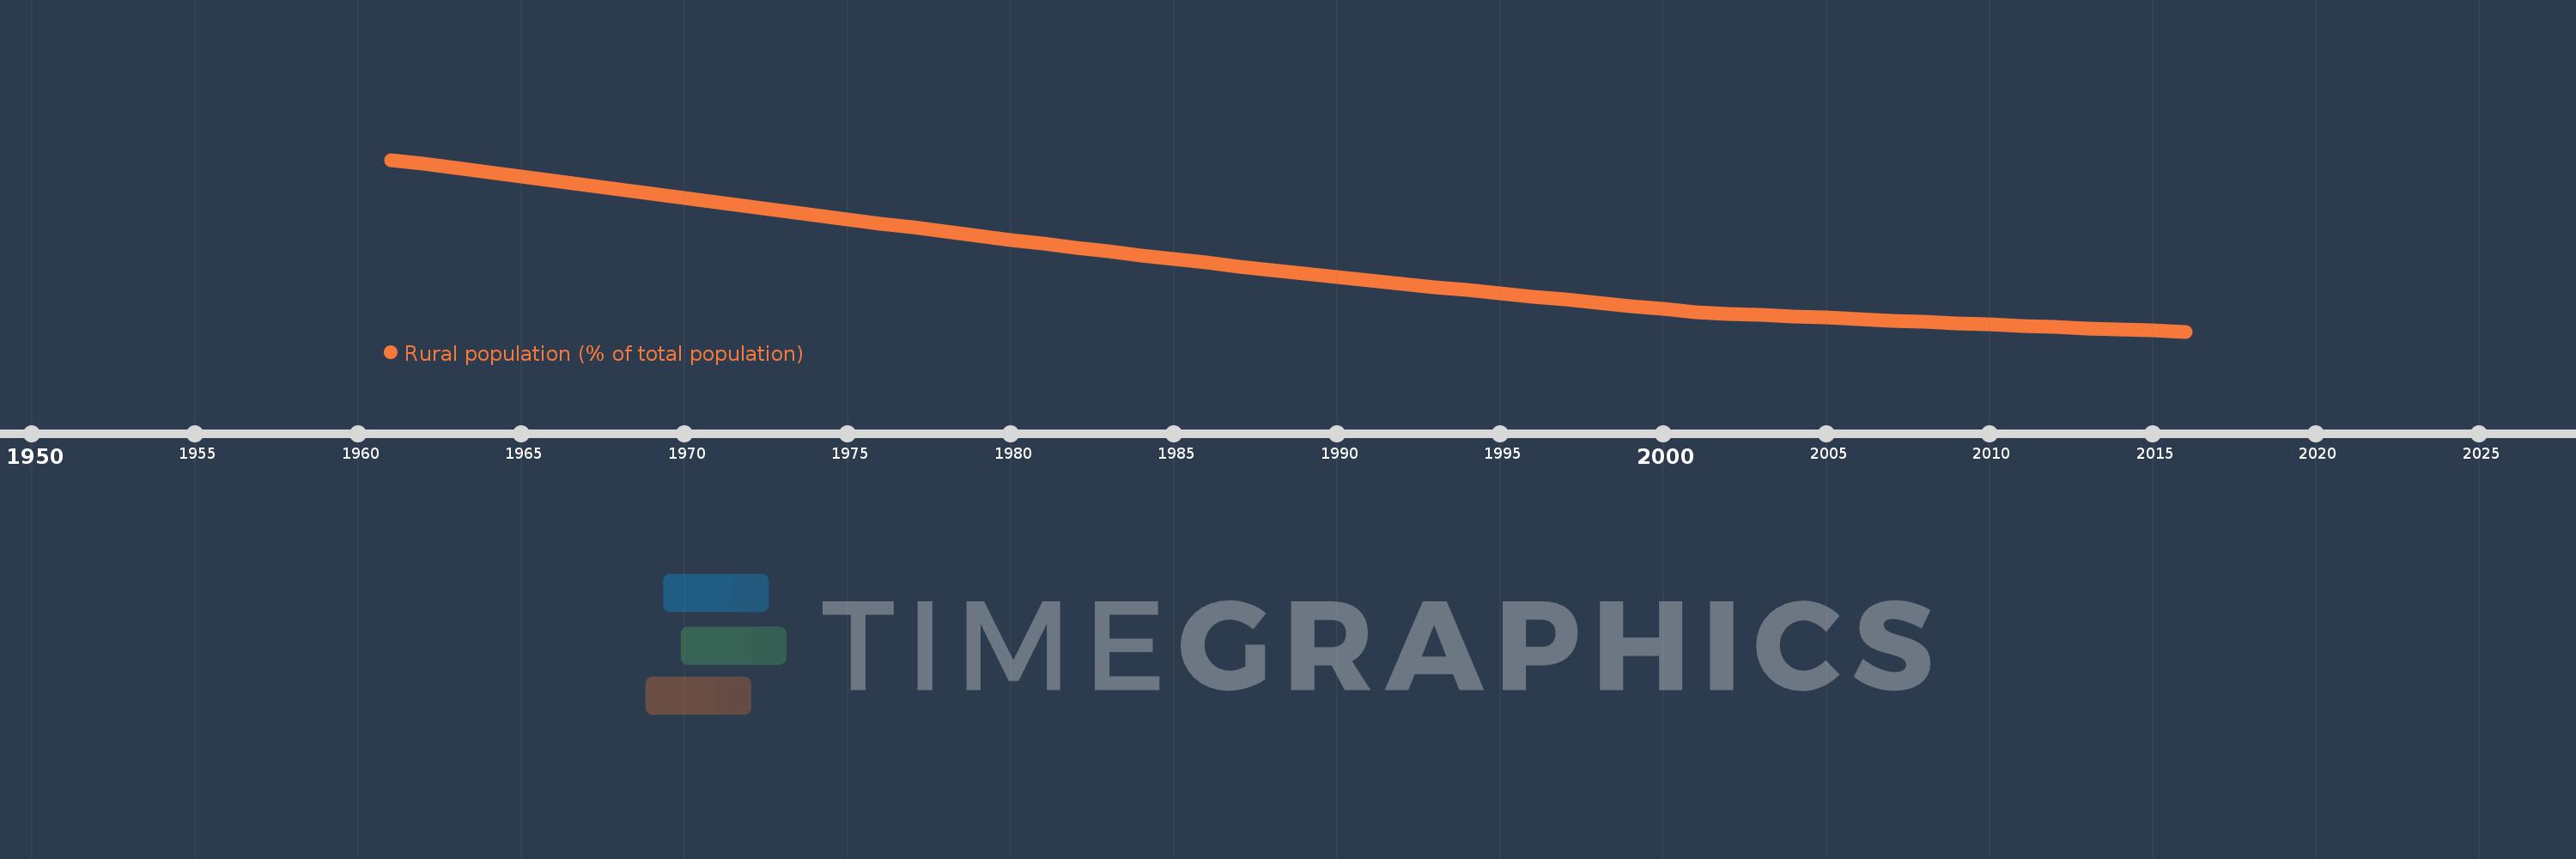
Rural population (% of total population)
2016,2015,2014,2013,2012,2011,2010,2009,2008,2007,2006,2005,2004,2003,2002,2001,2000,1999,1998,1997,1996,1995,1994,1993,1992,1991,1990,1989,1988,1987,1986,1985,1984,1983,1982,1981,1980,1979,1978,1977,1976,1975,1974,1973,1972,1971,1970,1969,1968,1967,1966,1965,1964,1963,1962,1961
Estas estatísticas em outros países:
AfghanistanAlbaniaAlgeriaAmerican SamoaAndorraAngolaAntigua and BarbudaArab WorldArgentinaArmeniaArubaAustraliaAustriaAzerbaijanBahamas, TheBahrainBangladeshBarbadosBelarusBelgiumBelizeBeninBermudaBhutanBoliviaBosnia and HerzegovinaBotswanaBrazilBritish Virgin IslandsBrunei DarussalamBulgariaBurkina FasoBurundiCabo VerdeCambodiaCameroonCanadaCaribbean small statesCayman IslandsCentral African RepublicCentral Europe and the BalticsChadChannel IslandsChileChinaColombiaComorosCongo, Dem. Rep.Congo, Rep.Costa RicaCote d'IvoireCroatiaCubaCuracaoCyprusCzech RepublicDenmarkDjiboutiDominicaDominican RepublicEarly-demographic dividendEast Asia & PacificEast Asia & Pacific (excluding high income)East Asia & Pacific (IDA & IBRD countries)EcuadorEgypt, Arab Rep.El SalvadorEquatorial GuineaEritreaEstoniaEthiopiaEuro areaEurope & Central AsiaEurope & Central Asia (excluding high income)Europe & Central Asia (IDA & IBRD countries)European UnionFaroe IslandsFijiFinlandFragile and conflict affected situationsFranceFrench PolynesiaGabonGambia, TheGeorgiaGermanyGhanaGibraltarGreeceGreenlandGrenadaGuamGuatemalaGuineaGuinea-BissauGuyanaHaitiHeavily indebted poor countries (HIPC)High incomeHondurasHong Kong SAR, ChinaHungaryIBRD onlyIcelandIDA & IBRD totalIDA blendIDA onlyIDA totalIndiaIndonesiaIran, Islamic Rep.IraqIrelandIsle of ManIsraelItalyJamaicaJapanJordanKazakhstanKenyaKiribatiKorea, Dem. People’s Rep.Korea, Rep.KuwaitKyrgyz RepublicLao PDRLate-demographic dividendLatin America & Caribbean Latin America & Caribbean (excluding high income)Latin America & the Caribbean (IDA & IBRD countries)LatviaLeast developed countries: UN classificationLebanonLesothoLiberiaLibyaLiechtensteinLithuaniaLow & middle incomeLow incomeLower middle incomeLuxembourgMacao SAR, ChinaMacedonia, FYRMadagascarMalawiMalaysiaMaldivesMaliMaltaMarshall IslandsMauritaniaMauritiusMexicoMicronesia, Fed. Sts.Middle East & North AfricaMiddle East & North Africa (excluding high income)Middle East & North Africa (IDA & IBRD countries)Middle incomeMoldovaMonacoMongoliaMontenegroMoroccoMozambiqueMyanmarNamibiaNauruNepalNetherlandsNew CaledoniaNew ZealandNicaraguaNigerNigeriaNorth AmericaNorthern Mariana IslandsNorwayOECD membersOmanOther small statesPacific island small statesPakistanPalauPanamaPapua New GuineaParaguayPeruPhilippinesPolandPortugalPost-demographic dividendPre-demographic dividendPuerto RicoQatarRomaniaRussian FederationRwandaSamoaSan MarinoSao Tome and PrincipeSaudi ArabiaSenegalSerbiaSeychellesSierra LeoneSingaporeSint Maarten (Dutch part)Slovak RepublicSloveniaSmall statesSolomon IslandsSomaliaSouth AfricaSouth AsiaSouth Asia (IDA & IBRD)South SudanSpainSri LankaSt. Kitts and NevisSt. LuciaSt. Vincent and the GrenadinesSub-Saharan Africa Sub-Saharan Africa (excluding high income)Sub-Saharan Africa (IDA & IBRD countries)SudanSurinameSwazilandSwedenSwitzerlandSyrian Arab RepublicTajikistanTanzaniaThailandTimor-LesteTogoTongaTrinidad and TobagoTunisiaTurkeyTurkmenistanTurks and Caicos IslandsTuvaluUgandaUkraineUnited Arab EmiratesUnited KingdomUnited StatesUpper middle incomeUruguayUzbekistanVanuatuVenezuela, RBVietnamVirgin Islands (U.S.)West Bank and GazaWorldYemen, Rep.ZambiaZimbabwe Linha do tempo:
Nesta escala de tempo está apresentado um gráfico de 1961 ano até 2016 ano Brazil. Dados de 1960 ano ausente. O número de observações reais por data: 56.
Fonte (nome):
Indicadores de desenvolvimento mundial
Fonte (organização):
World Bank Staff estimates based on United Nations, World Urbanization Prospects.
Categorias:
Agriculture & Rural Development
Foi atualizado:
23 abr 2017 ano
Indicadores de alterações dos valores ao longo dos anos
Mínimo:
14.313
1 jan 2016 ano
Máximo:
53.861
1 jan 1961 ano
Na data de observação
Valor
Mudança absoluta
A alteração em relação ao valor anterior
1 jan 1961 ano
53.861
+53.861
0.0%
1 jan 1962 ano
52.878
-0.983
-1.83%
1 jan 1963 ano
51.901
-0.977
-1.85%
1 jan 1964 ano
50.922
-0.979
-1.89%
1 jan 1965 ano
49.941
-0.981
-1.93%
1 jan 1966 ano
48.963
-0.978
-1.96%
1 jan 1967 ano
47.984
-0.979
-2.0%
1 jan 1968 ano
47.007
-0.977
-2.04%
1 jan 1969 ano
46.03
-0.977
-2.08%
1 jan 1970 ano
45.06
-0.97
-2.11%
1 jan 1971 ano
44.091
-0.969
-2.15%
1 jan 1972 ano
43.106
-0.985
-2.23%
1 jan 1973 ano
42.121
-0.985
-2.29%
1 jan 1974 ano
41.145
-0.976
-2.32%
1 jan 1975 ano
40.174
-0.971
-2.36%
1 jan 1976 ano
39.211
-0.963
-2.4%
1 jan 1977 ano
38.255
-0.956
-2.44%
1 jan 1978 ano
37.311
-0.944
-2.47%
1 jan 1979 ano
36.375
-0.936
-2.51%
1 jan 1980 ano
35.449
-0.926
-2.55%
1 jan 1981 ano
34.532
-0.917
-2.59%
1 jan 1982 ano
33.63
-0.902
-2.61%
1 jan 1983 ano
32.738
-0.892
-2.65%
1 jan 1984 ano
31.858
-0.88
-2.69%
1 jan 1985 ano
30.99
-0.868
-2.72%
1 jan 1986 ano
30.138
-0.852
-2.75%
1 jan 1987 ano
29.297
-0.841
-2.79%
1 jan 1988 ano
28.471
-0.826
-2.82%
1 jan 1989 ano
27.658
-0.813
-2.86%
1 jan 1990 ano
26.861
-0.797
-2.88%
1 jan 1991 ano
26.078
-0.783
-2.92%
1 jan 1992 ano
25.31
-0.768
-2.95%
1 jan 1993 ano
24.556
-0.754
-2.98%
1 jan 1994 ano
23.819
-0.737
-3.0%
1 jan 1995 ano
23.097
-0.722
-3.03%
1 jan 1996 ano
22.39
-0.707
-3.06%
1 jan 1997 ano
21.698
-0.692
-3.09%
1 jan 1998 ano
20.952
-0.746
-3.44%
1 jan 1999 ano
20.219
-0.733
-3.5%
1 jan 2000 ano
19.504
-0.715
-3.54%
1 jan 2001 ano
18.808
-0.696
-3.57%
1 jan 2002 ano
18.447
-0.361
-1.92%
1 jan 2003 ano
18.12
-0.327
-1.77%
1 jan 2004 ano
17.797
-0.323
-1.78%
1 jan 2005 ano
17.479
-0.318
-1.79%
1 jan 2006 ano
17.166
-0.313
-1.79%
1 jan 2007 ano
16.857
-0.309
-1.8%
1 jan 2008 ano
16.552
-0.305
-1.81%
1 jan 2009 ano
16.251
-0.301
-1.82%
1 jan 2010 ano
15.956
-0.295
-1.82%
1 jan 2011 ano
15.665
-0.291
-1.82%
1 jan 2012 ano
15.377
-0.288
-1.84%
1 jan 2013 ano
15.099
-0.278
-1.81%
1 jan 2014 ano
14.829
-0.27
-1.79%
1 jan 2015 ano
14.567
-0.262
-1.77%
1 jan 2016 ano
14.313
-0.254
-1.74%
Classificação de países por estatísticas atuais por anos


Comentários: