29
/pt/
pt
AIzaSyAYiBZKx7MnpbEhh9jyipgxe19OcubqV5w
April 1, 2024
164223
Japan
JPN
true
2
1
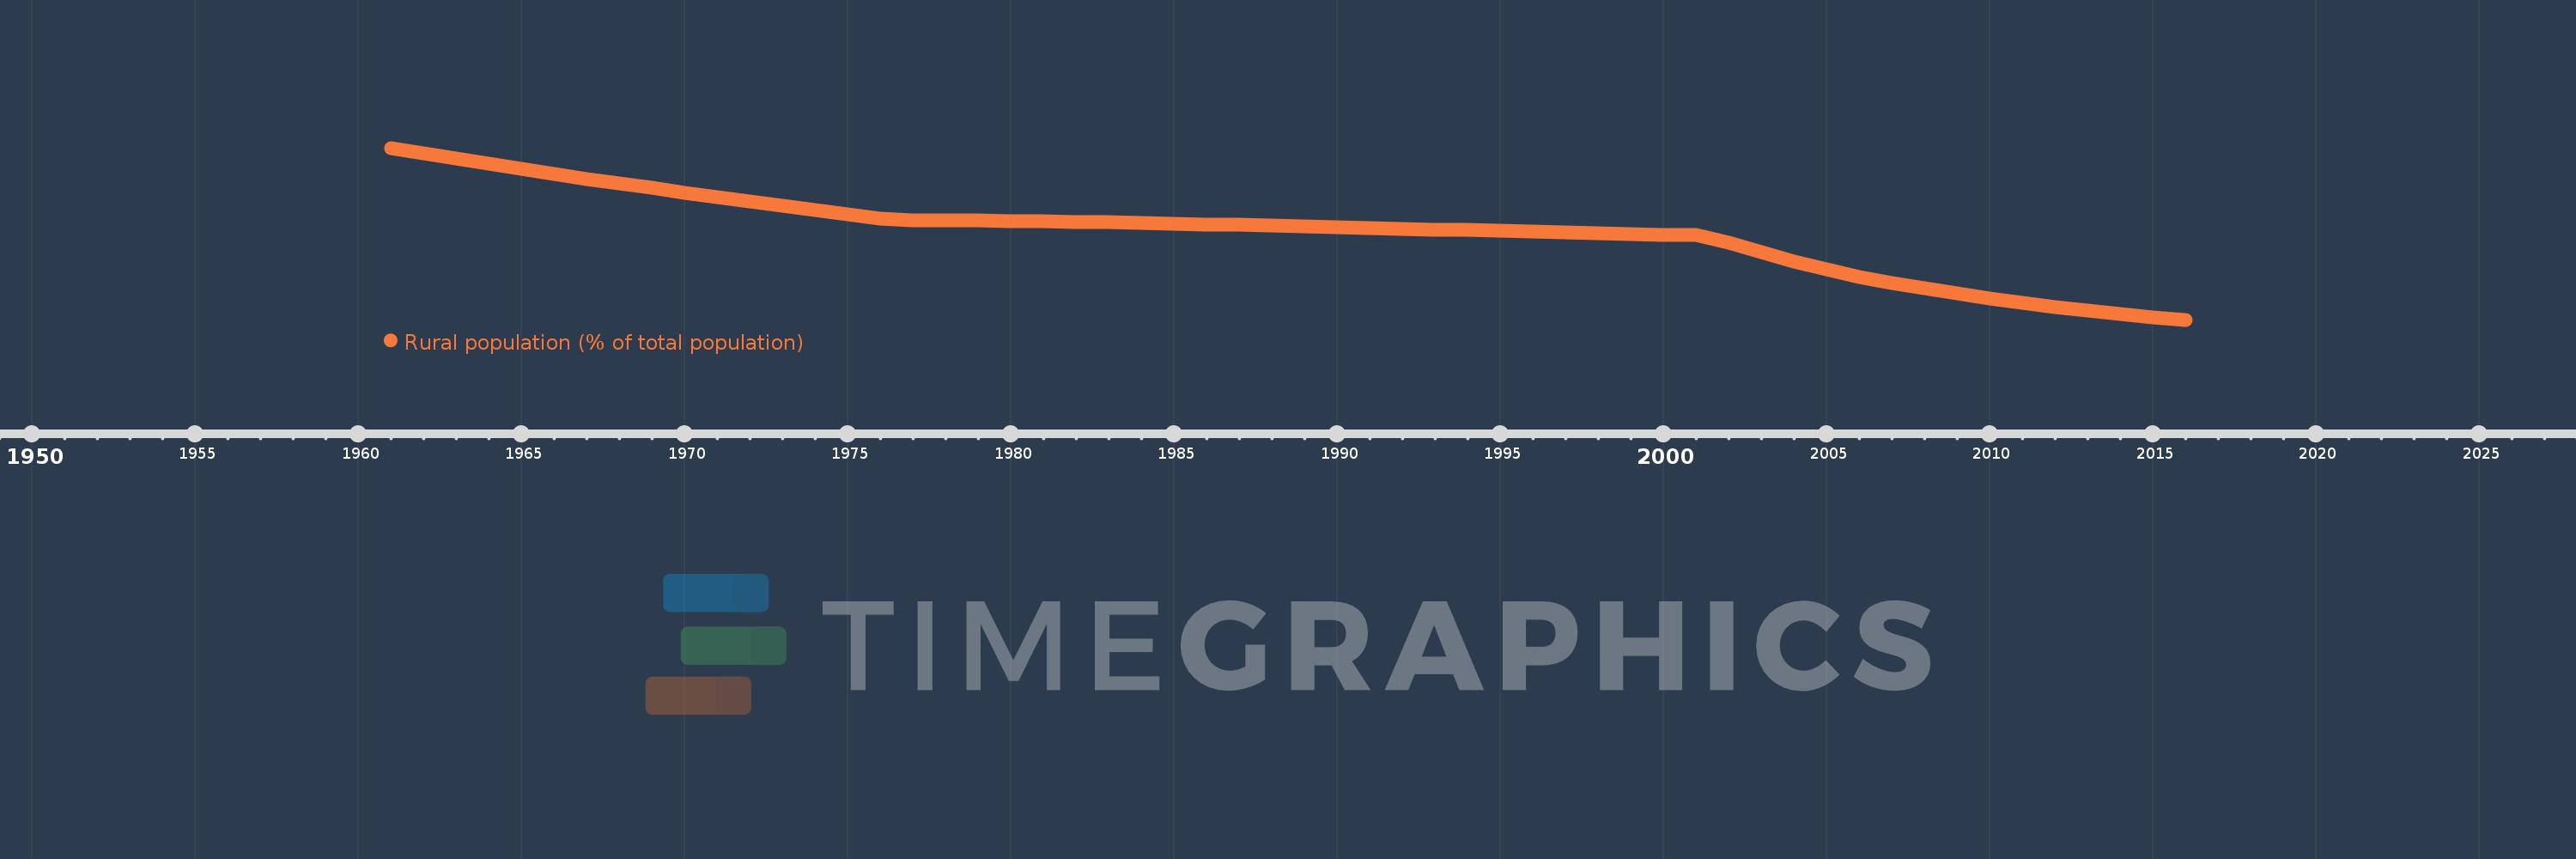
Rural population (% of total population)
2016,2015,2014,2013,2012,2011,2010,2009,2008,2007,2006,2005,2004,2003,2002,2001,2000,1999,1998,1997,1996,1995,1994,1993,1992,1991,1990,1989,1988,1987,1986,1985,1984,1983,1982,1981,1980,1979,1978,1977,1976,1975,1974,1973,1972,1971,1970,1969,1968,1967,1966,1965,1964,1963,1962,1961
Estas estatísticas em outros países:
AfghanistanAlbaniaAlgeriaAmerican SamoaAndorraAngolaAntigua and BarbudaArab WorldArgentinaArmeniaArubaAustraliaAustriaAzerbaijanBahamas, TheBahrainBangladeshBarbadosBelarusBelgiumBelizeBeninBermudaBhutanBoliviaBosnia and HerzegovinaBotswanaBrazilBritish Virgin IslandsBrunei DarussalamBulgariaBurkina FasoBurundiCabo VerdeCambodiaCameroonCanadaCaribbean small statesCayman IslandsCentral African RepublicCentral Europe and the BalticsChadChannel IslandsChileChinaColombiaComorosCongo, Dem. Rep.Congo, Rep.Costa RicaCote d'IvoireCroatiaCubaCuracaoCyprusCzech RepublicDenmarkDjiboutiDominicaDominican RepublicEarly-demographic dividendEast Asia & PacificEast Asia & Pacific (excluding high income)East Asia & Pacific (IDA & IBRD countries)EcuadorEgypt, Arab Rep.El SalvadorEquatorial GuineaEritreaEstoniaEthiopiaEuro areaEurope & Central AsiaEurope & Central Asia (excluding high income)Europe & Central Asia (IDA & IBRD countries)European UnionFaroe IslandsFijiFinlandFragile and conflict affected situationsFranceFrench PolynesiaGabonGambia, TheGeorgiaGermanyGhanaGibraltarGreeceGreenlandGrenadaGuamGuatemalaGuineaGuinea-BissauGuyanaHaitiHeavily indebted poor countries (HIPC)High incomeHondurasHong Kong SAR, ChinaHungaryIBRD onlyIcelandIDA & IBRD totalIDA blendIDA onlyIDA totalIndiaIndonesiaIran, Islamic Rep.IraqIrelandIsle of ManIsraelItalyJamaicaJapanJordanKazakhstanKenyaKiribatiKorea, Dem. People’s Rep.Korea, Rep.KuwaitKyrgyz RepublicLao PDRLate-demographic dividendLatin America & Caribbean Latin America & Caribbean (excluding high income)Latin America & the Caribbean (IDA & IBRD countries)LatviaLeast developed countries: UN classificationLebanonLesothoLiberiaLibyaLiechtensteinLithuaniaLow & middle incomeLow incomeLower middle incomeLuxembourgMacao SAR, ChinaMacedonia, FYRMadagascarMalawiMalaysiaMaldivesMaliMaltaMarshall IslandsMauritaniaMauritiusMexicoMicronesia, Fed. Sts.Middle East & North AfricaMiddle East & North Africa (excluding high income)Middle East & North Africa (IDA & IBRD countries)Middle incomeMoldovaMonacoMongoliaMontenegroMoroccoMozambiqueMyanmarNamibiaNauruNepalNetherlandsNew CaledoniaNew ZealandNicaraguaNigerNigeriaNorth AmericaNorthern Mariana IslandsNorwayOECD membersOmanOther small statesPacific island small statesPakistanPalauPanamaPapua New GuineaParaguayPeruPhilippinesPolandPortugalPost-demographic dividendPre-demographic dividendPuerto RicoQatarRomaniaRussian FederationRwandaSamoaSan MarinoSao Tome and PrincipeSaudi ArabiaSenegalSerbiaSeychellesSierra LeoneSingaporeSint Maarten (Dutch part)Slovak RepublicSloveniaSmall statesSolomon IslandsSomaliaSouth AfricaSouth AsiaSouth Asia (IDA & IBRD)South SudanSpainSri LankaSt. Kitts and NevisSt. LuciaSt. Vincent and the GrenadinesSub-Saharan Africa Sub-Saharan Africa (excluding high income)Sub-Saharan Africa (IDA & IBRD countries)SudanSurinameSwazilandSwedenSwitzerlandSyrian Arab RepublicTajikistanTanzaniaThailandTimor-LesteTogoTongaTrinidad and TobagoTunisiaTurkeyTurkmenistanTurks and Caicos IslandsTuvaluUgandaUkraineUnited Arab EmiratesUnited KingdomUnited StatesUpper middle incomeUruguayUzbekistanVanuatuVenezuela, RBVietnamVirgin Islands (U.S.)West Bank and GazaWorldYemen, Rep.ZambiaZimbabwe Linha do tempo:
Nesta escala de tempo está apresentado um gráfico de 1961 ano até 2016 ano Japan. Dados de 1960 ano ausente. O número de observações reais por data: 56.
Fonte (nome):
Indicadores de desenvolvimento mundial
Fonte (organização):
World Bank Staff estimates based on United Nations, World Urbanization Prospects.
Categorias:
Agriculture & Rural Development
Foi atualizado:
23 abr 2017 ano
Indicadores de alterações dos valores ao longo dos anos
Mínimo:
6.502
1 jan 2016 ano
Máximo:
36.728
1 jan 1961 ano
Na data de observação
Valor
Mudança absoluta
A alteração em relação ao valor anterior
1 jan 1961 ano
36.728
+36.728
0.0%
1 jan 1962 ano
35.787
-0.941
-2.56%
1 jan 1963 ano
34.856
-0.931
-2.6%
1 jan 1964 ano
33.936
-0.92
-2.64%
1 jan 1965 ano
33.028
-0.908
-2.68%
1 jan 1966 ano
32.134
-0.894
-2.71%
1 jan 1967 ano
31.296
-0.838
-2.61%
1 jan 1968 ano
30.484
-0.812
-2.59%
1 jan 1969 ano
29.684
-0.8
-2.62%
1 jan 1970 ano
28.898
-0.786
-2.65%
1 jan 1971 ano
28.123
-0.775
-2.68%
1 jan 1972 ano
27.334
-0.789
-2.81%
1 jan 1973 ano
26.548
-0.786
-2.88%
1 jan 1974 ano
25.78
-0.768
-2.89%
1 jan 1975 ano
25.025
-0.755
-2.93%
1 jan 1976 ano
24.284
-0.741
-2.96%
1 jan 1977 ano
24.056
-0.228
-0.94%
1 jan 1978 ano
23.998
-0.058
-0.24%
1 jan 1979 ano
23.94
-0.058
-0.24%
1 jan 1980 ano
23.882
-0.058
-0.24%
1 jan 1981 ano
23.825
-0.057
-0.24%
1 jan 1982 ano
23.727
-0.098
-0.41%
1 jan 1983 ano
23.617
-0.11
-0.46%
1 jan 1984 ano
23.507
-0.11
-0.47%
1 jan 1985 ano
23.397
-0.11
-0.47%
1 jan 1986 ano
23.288
-0.109
-0.47%
1 jan 1987 ano
23.165
-0.123
-0.53%
1 jan 1988 ano
23.038
-0.127
-0.55%
1 jan 1989 ano
22.912
-0.126
-0.55%
1 jan 1990 ano
22.787
-0.125
-0.55%
1 jan 1991 ano
22.661
-0.126
-0.55%
1 jan 1992 ano
22.527
-0.134
-0.59%
1 jan 1993 ano
22.39
-0.137
-0.61%
1 jan 1994 ano
22.254
-0.136
-0.61%
1 jan 1995 ano
22.119
-0.135
-0.61%
1 jan 1996 ano
21.984
-0.135
-0.61%
1 jan 1997 ano
21.855
-0.129
-0.59%
1 jan 1998 ano
21.728
-0.127
-0.58%
1 jan 1999 ano
21.602
-0.126
-0.58%
1 jan 2000 ano
21.477
-0.125
-0.58%
1 jan 2001 ano
21.351
-0.126
-0.59%
1 jan 2002 ano
20.01
-1.341
-6.28%
1 jan 2003 ano
18.353
-1.657
-8.28%
1 jan 2004 ano
16.804
-1.549
-8.44%
1 jan 2005 ano
15.36
-1.444
-8.59%
1 jan 2006 ano
14.022
-1.338
-8.71%
1 jan 2007 ano
12.943
-1.079
-7.7%
1 jan 2008 ano
11.987
-0.956
-7.39%
1 jan 2009 ano
11.091
-0.896
-7.47%
1 jan 2010 ano
10.257
-0.834
-7.52%
1 jan 2011 ano
9.478
-0.779
-7.59%
1 jan 2012 ano
8.752
-0.726
-7.66%
1 jan 2013 ano
8.098
-0.654
-7.47%
1 jan 2014 ano
7.509
-0.589
-7.27%
1 jan 2015 ano
6.979
-0.53
-7.06%
1 jan 2016 ano
6.502
-0.477
-6.83%
Classificação de países por estatísticas atuais por anos


Comentários: