29
/pt/
pt
AIzaSyAYiBZKx7MnpbEhh9jyipgxe19OcubqV5w
April 1, 2024
239948
Sierra Leone
SLE
true
2
1
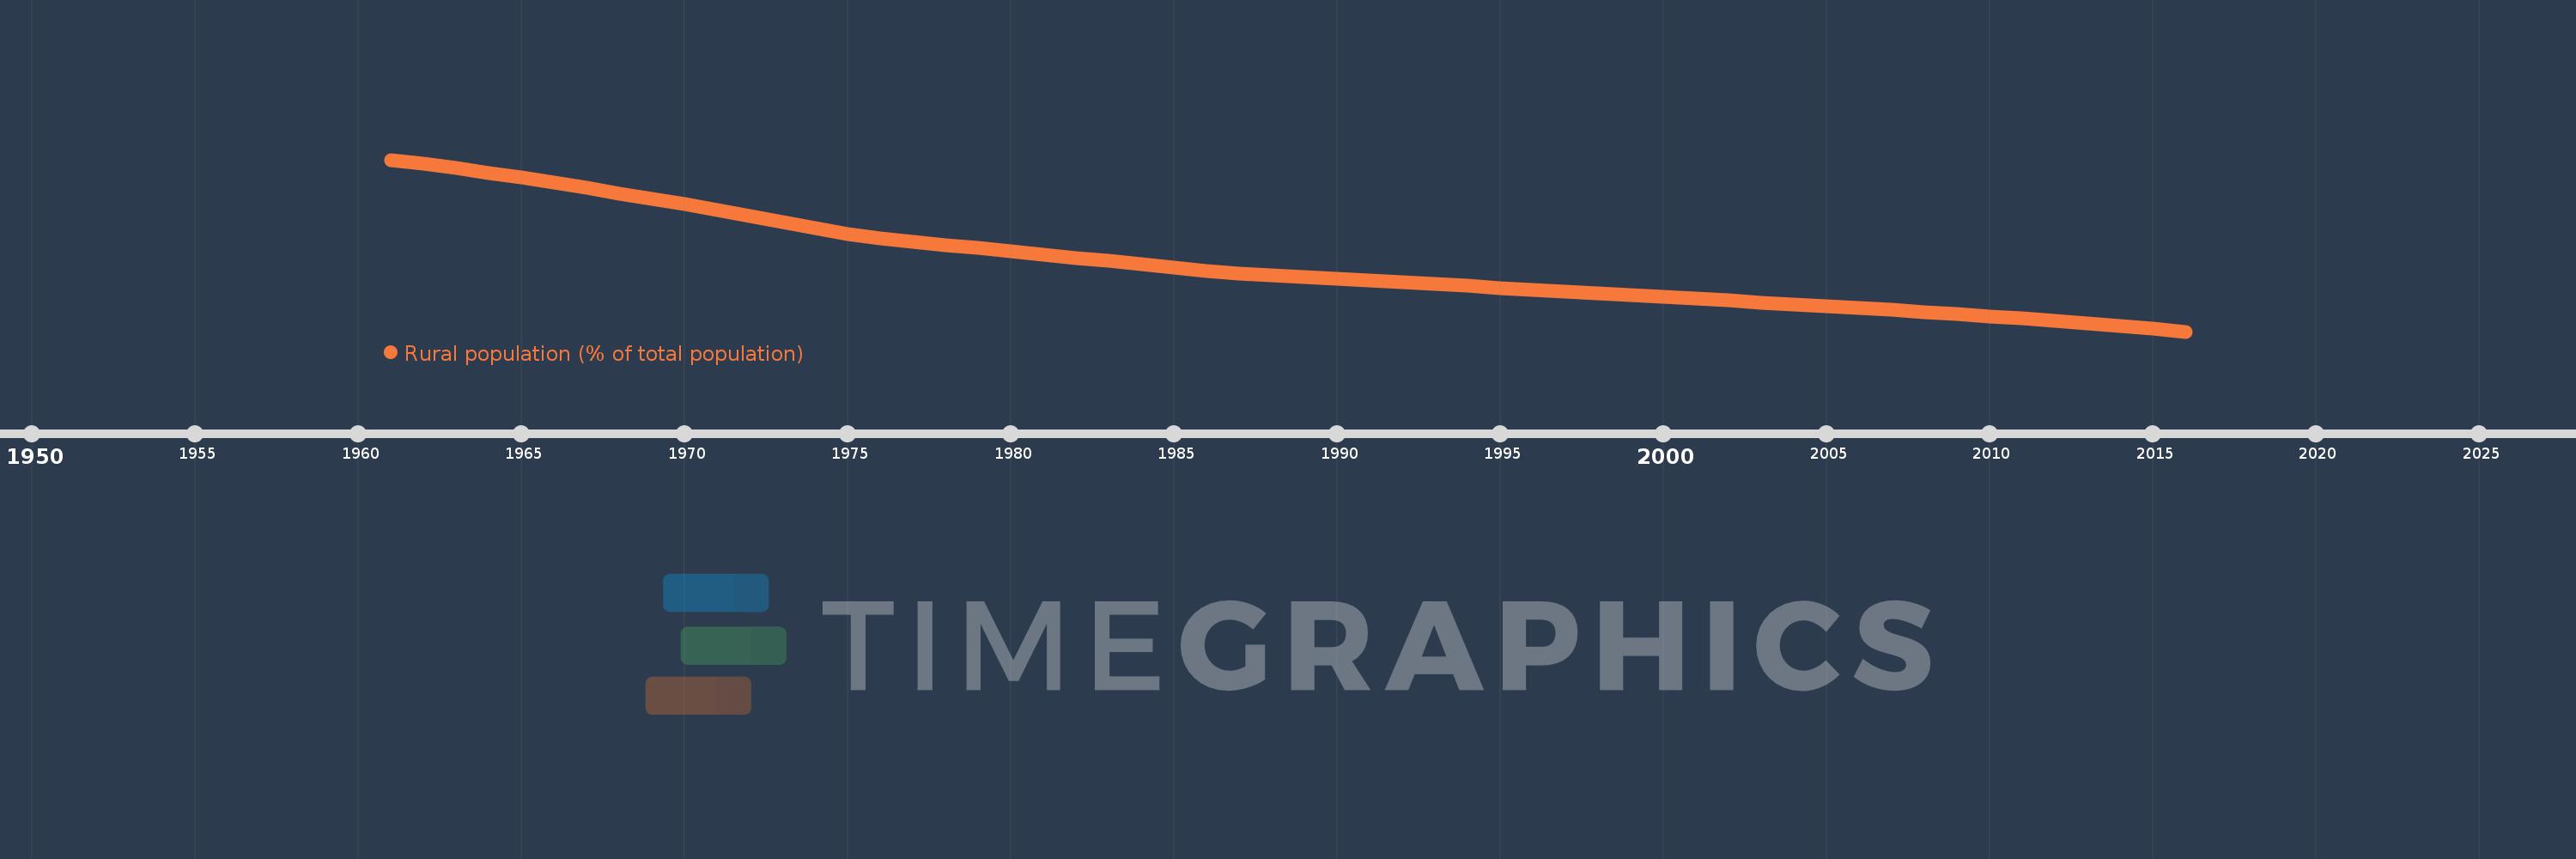
Rural population (% of total population)
2016,2015,2014,2013,2012,2011,2010,2009,2008,2007,2006,2005,2004,2003,2002,2001,2000,1999,1998,1997,1996,1995,1994,1993,1992,1991,1990,1989,1988,1987,1986,1985,1984,1983,1982,1981,1980,1979,1978,1977,1976,1975,1974,1973,1972,1971,1970,1969,1968,1967,1966,1965,1964,1963,1962,1961
Estas estatísticas em outros países:
AfghanistanAlbaniaAlgeriaAmerican SamoaAndorraAngolaAntigua and BarbudaArab WorldArgentinaArmeniaArubaAustraliaAustriaAzerbaijanBahamas, TheBahrainBangladeshBarbadosBelarusBelgiumBelizeBeninBermudaBhutanBoliviaBosnia and HerzegovinaBotswanaBrazilBritish Virgin IslandsBrunei DarussalamBulgariaBurkina FasoBurundiCabo VerdeCambodiaCameroonCanadaCaribbean small statesCayman IslandsCentral African RepublicCentral Europe and the BalticsChadChannel IslandsChileChinaColombiaComorosCongo, Dem. Rep.Congo, Rep.Costa RicaCote d'IvoireCroatiaCubaCuracaoCyprusCzech RepublicDenmarkDjiboutiDominicaDominican RepublicEarly-demographic dividendEast Asia & PacificEast Asia & Pacific (excluding high income)East Asia & Pacific (IDA & IBRD countries)EcuadorEgypt, Arab Rep.El SalvadorEquatorial GuineaEritreaEstoniaEthiopiaEuro areaEurope & Central AsiaEurope & Central Asia (excluding high income)Europe & Central Asia (IDA & IBRD countries)European UnionFaroe IslandsFijiFinlandFragile and conflict affected situationsFranceFrench PolynesiaGabonGambia, TheGeorgiaGermanyGhanaGibraltarGreeceGreenlandGrenadaGuamGuatemalaGuineaGuinea-BissauGuyanaHaitiHeavily indebted poor countries (HIPC)High incomeHondurasHong Kong SAR, ChinaHungaryIBRD onlyIcelandIDA & IBRD totalIDA blendIDA onlyIDA totalIndiaIndonesiaIran, Islamic Rep.IraqIrelandIsle of ManIsraelItalyJamaicaJapanJordanKazakhstanKenyaKiribatiKorea, Dem. People’s Rep.Korea, Rep.KuwaitKyrgyz RepublicLao PDRLate-demographic dividendLatin America & Caribbean Latin America & Caribbean (excluding high income)Latin America & the Caribbean (IDA & IBRD countries)LatviaLeast developed countries: UN classificationLebanonLesothoLiberiaLibyaLiechtensteinLithuaniaLow & middle incomeLow incomeLower middle incomeLuxembourgMacao SAR, ChinaMacedonia, FYRMadagascarMalawiMalaysiaMaldivesMaliMaltaMarshall IslandsMauritaniaMauritiusMexicoMicronesia, Fed. Sts.Middle East & North AfricaMiddle East & North Africa (excluding high income)Middle East & North Africa (IDA & IBRD countries)Middle incomeMoldovaMonacoMongoliaMontenegroMoroccoMozambiqueMyanmarNamibiaNauruNepalNetherlandsNew CaledoniaNew ZealandNicaraguaNigerNigeriaNorth AmericaNorthern Mariana IslandsNorwayOECD membersOmanOther small statesPacific island small statesPakistanPalauPanamaPapua New GuineaParaguayPeruPhilippinesPolandPortugalPost-demographic dividendPre-demographic dividendPuerto RicoQatarRomaniaRussian FederationRwandaSamoaSan MarinoSao Tome and PrincipeSaudi ArabiaSenegalSerbiaSeychellesSierra LeoneSingaporeSint Maarten (Dutch part)Slovak RepublicSloveniaSmall statesSolomon IslandsSomaliaSouth AfricaSouth AsiaSouth Asia (IDA & IBRD)South SudanSpainSri LankaSt. Kitts and NevisSt. LuciaSt. Vincent and the GrenadinesSub-Saharan Africa Sub-Saharan Africa (excluding high income)Sub-Saharan Africa (IDA & IBRD countries)SudanSurinameSwazilandSwedenSwitzerlandSyrian Arab RepublicTajikistanTanzaniaThailandTimor-LesteTogoTongaTrinidad and TobagoTunisiaTurkeyTurkmenistanTurks and Caicos IslandsTuvaluUgandaUkraineUnited Arab EmiratesUnited KingdomUnited StatesUpper middle incomeUruguayUzbekistanVanuatuVenezuela, RBVietnamVirgin Islands (U.S.)West Bank and GazaWorldYemen, Rep.ZambiaZimbabwe Linha do tempo:
Nesta escala de tempo está apresentado um gráfico de 1961 ano até 2016 ano Sierra Leone. Dados de 1960 ano ausente. O número de observações reais por data: 56.
Fonte (nome):
Indicadores de desenvolvimento mundial
Fonte (organização):
World Bank Staff estimates based on United Nations, World Urbanization Prospects.
Categorias:
Agriculture & Rural Development
Foi atualizado:
23 abr 2017 ano
Indicadores de alterações dos valores ao longo dos anos
Mínimo:
60.058
1 jan 2016 ano
Máximo:
82.648
1 jan 1961 ano
Na data de observação
Valor
Mudança absoluta
A alteração em relação ao valor anterior
1 jan 1961 ano
82.648
+82.648
0.0%
1 jan 1962 ano
82.097
-0.551
-0.67%
1 jan 1963 ano
81.533
-0.564
-0.69%
1 jan 1964 ano
80.94
-0.593
-0.73%
1 jan 1965 ano
80.288
-0.652
-0.81%
1 jan 1966 ano
79.621
-0.667
-0.83%
1 jan 1967 ano
78.936
-0.685
-0.86%
1 jan 1968 ano
78.235
-0.701
-0.89%
1 jan 1969 ano
77.516
-0.719
-0.92%
1 jan 1970 ano
76.782
-0.734
-0.95%
1 jan 1971 ano
76.031
-0.751
-0.98%
1 jan 1972 ano
75.263
-0.768
-1.01%
1 jan 1973 ano
74.478
-0.785
-1.04%
1 jan 1974 ano
73.679
-0.799
-1.07%
1 jan 1975 ano
72.863
-0.816
-1.11%
1 jan 1976 ano
72.271
-0.592
-0.81%
1 jan 1977 ano
71.86
-0.411
-0.57%
1 jan 1978 ano
71.446
-0.414
-0.58%
1 jan 1979 ano
71.028
-0.418
-0.59%
1 jan 1980 ano
70.606
-0.422
-0.59%
1 jan 1981 ano
70.181
-0.425
-0.6%
1 jan 1982 ano
69.752
-0.429
-0.61%
1 jan 1983 ano
69.32
-0.432
-0.62%
1 jan 1984 ano
68.885
-0.435
-0.63%
1 jan 1985 ano
68.445
-0.44
-0.64%
1 jan 1986 ano
68.003
-0.442
-0.65%
1 jan 1987 ano
67.675
-0.328
-0.48%
1 jan 1988 ano
67.445
-0.23
-0.34%
1 jan 1989 ano
67.213
-0.232
-0.34%
1 jan 1990 ano
66.981
-0.232
-0.35%
1 jan 1991 ano
66.748
-0.233
-0.35%
1 jan 1992 ano
66.515
-0.233
-0.35%
1 jan 1993 ano
66.28
-0.235
-0.35%
1 jan 1994 ano
66.045
-0.235
-0.35%
1 jan 1995 ano
65.808
-0.237
-0.36%
1 jan 1996 ano
65.571
-0.237
-0.36%
1 jan 1997 ano
65.333
-0.238
-0.36%
1 jan 1998 ano
65.095
-0.238
-0.36%
1 jan 1999 ano
64.856
-0.239
-0.37%
1 jan 2000 ano
64.616
-0.24
-0.37%
1 jan 2001 ano
64.374
-0.242
-0.37%
1 jan 2002 ano
64.133
-0.241
-0.37%
1 jan 2003 ano
63.891
-0.242
-0.38%
1 jan 2004 ano
63.648
-0.243
-0.38%
1 jan 2005 ano
63.404
-0.244
-0.38%
1 jan 2006 ano
63.16
-0.244
-0.38%
1 jan 2007 ano
62.904
-0.256
-0.41%
1 jan 2008 ano
62.636
-0.268
-0.43%
1 jan 2009 ano
62.355
-0.281
-0.45%
1 jan 2010 ano
62.063
-0.292
-0.47%
1 jan 2011 ano
61.759
-0.304
-0.49%
1 jan 2012 ano
61.443
-0.316
-0.51%
1 jan 2013 ano
61.115
-0.328
-0.53%
1 jan 2014 ano
60.774
-0.341
-0.56%
1 jan 2015 ano
60.422
-0.352
-0.58%
1 jan 2016 ano
60.058
-0.364
-0.6%
Classificação de países por estatísticas atuais por anos


Comentários: