29
/pt/
pt
AIzaSyAYiBZKx7MnpbEhh9jyipgxe19OcubqV5w
April 1, 2024
248018
Spain
ESP
true
2
1
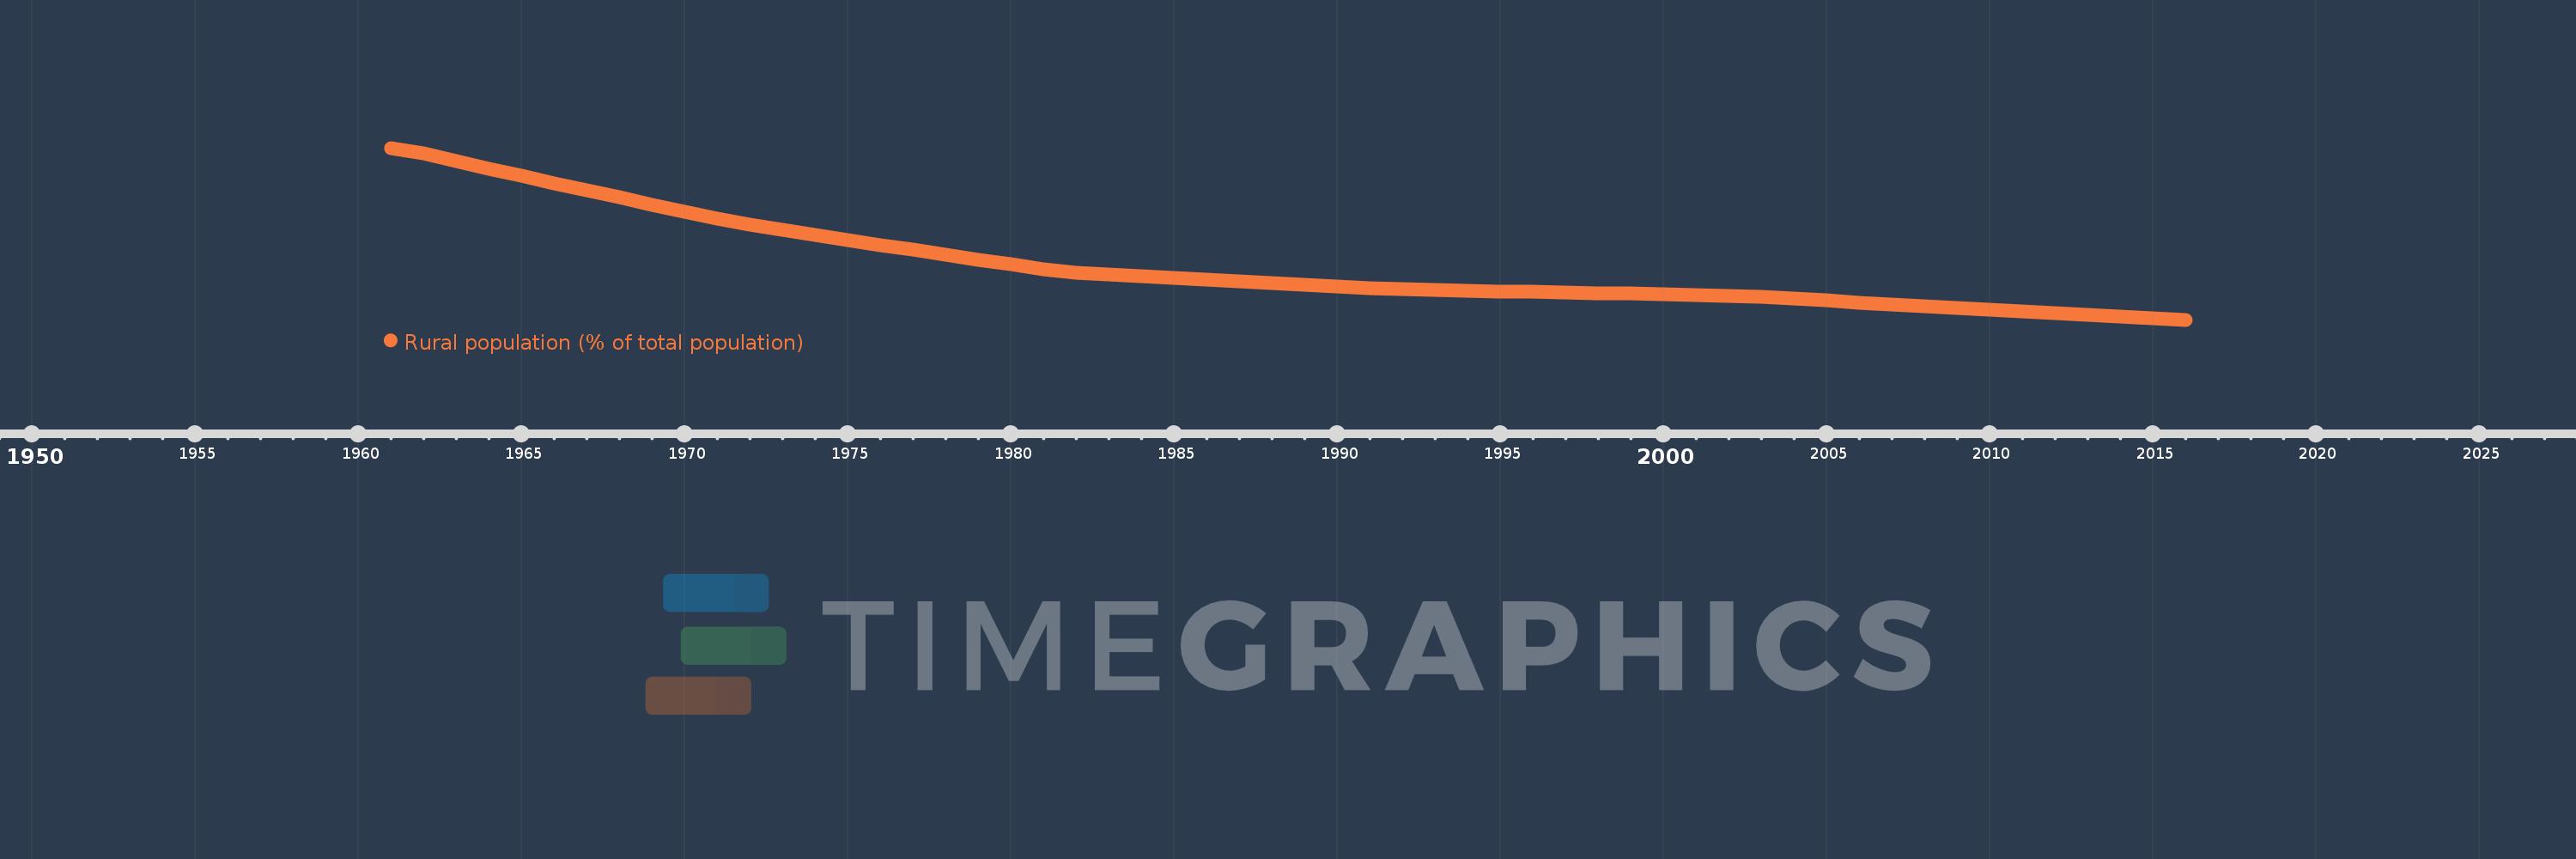
Rural population (% of total population)
2016,2015,2014,2013,2012,2011,2010,2009,2008,2007,2006,2005,2004,2003,2002,2001,2000,1999,1998,1997,1996,1995,1994,1993,1992,1991,1990,1989,1988,1987,1986,1985,1984,1983,1982,1981,1980,1979,1978,1977,1976,1975,1974,1973,1972,1971,1970,1969,1968,1967,1966,1965,1964,1963,1962,1961
Estas estatísticas em outros países:
AfghanistanAlbaniaAlgeriaAmerican SamoaAndorraAngolaAntigua and BarbudaArab WorldArgentinaArmeniaArubaAustraliaAustriaAzerbaijanBahamas, TheBahrainBangladeshBarbadosBelarusBelgiumBelizeBeninBermudaBhutanBoliviaBosnia and HerzegovinaBotswanaBrazilBritish Virgin IslandsBrunei DarussalamBulgariaBurkina FasoBurundiCabo VerdeCambodiaCameroonCanadaCaribbean small statesCayman IslandsCentral African RepublicCentral Europe and the BalticsChadChannel IslandsChileChinaColombiaComorosCongo, Dem. Rep.Congo, Rep.Costa RicaCote d'IvoireCroatiaCubaCuracaoCyprusCzech RepublicDenmarkDjiboutiDominicaDominican RepublicEarly-demographic dividendEast Asia & PacificEast Asia & Pacific (excluding high income)East Asia & Pacific (IDA & IBRD countries)EcuadorEgypt, Arab Rep.El SalvadorEquatorial GuineaEritreaEstoniaEthiopiaEuro areaEurope & Central AsiaEurope & Central Asia (excluding high income)Europe & Central Asia (IDA & IBRD countries)European UnionFaroe IslandsFijiFinlandFragile and conflict affected situationsFranceFrench PolynesiaGabonGambia, TheGeorgiaGermanyGhanaGibraltarGreeceGreenlandGrenadaGuamGuatemalaGuineaGuinea-BissauGuyanaHaitiHeavily indebted poor countries (HIPC)High incomeHondurasHong Kong SAR, ChinaHungaryIBRD onlyIcelandIDA & IBRD totalIDA blendIDA onlyIDA totalIndiaIndonesiaIran, Islamic Rep.IraqIrelandIsle of ManIsraelItalyJamaicaJapanJordanKazakhstanKenyaKiribatiKorea, Dem. People’s Rep.Korea, Rep.KuwaitKyrgyz RepublicLao PDRLate-demographic dividendLatin America & Caribbean Latin America & Caribbean (excluding high income)Latin America & the Caribbean (IDA & IBRD countries)LatviaLeast developed countries: UN classificationLebanonLesothoLiberiaLibyaLiechtensteinLithuaniaLow & middle incomeLow incomeLower middle incomeLuxembourgMacao SAR, ChinaMacedonia, FYRMadagascarMalawiMalaysiaMaldivesMaliMaltaMarshall IslandsMauritaniaMauritiusMexicoMicronesia, Fed. Sts.Middle East & North AfricaMiddle East & North Africa (excluding high income)Middle East & North Africa (IDA & IBRD countries)Middle incomeMoldovaMonacoMongoliaMontenegroMoroccoMozambiqueMyanmarNamibiaNauruNepalNetherlandsNew CaledoniaNew ZealandNicaraguaNigerNigeriaNorth AmericaNorthern Mariana IslandsNorwayOECD membersOmanOther small statesPacific island small statesPakistanPalauPanamaPapua New GuineaParaguayPeruPhilippinesPolandPortugalPost-demographic dividendPre-demographic dividendPuerto RicoQatarRomaniaRussian FederationRwandaSamoaSan MarinoSao Tome and PrincipeSaudi ArabiaSenegalSerbiaSeychellesSierra LeoneSingaporeSint Maarten (Dutch part)Slovak RepublicSloveniaSmall statesSolomon IslandsSomaliaSouth AfricaSouth AsiaSouth Asia (IDA & IBRD)South SudanSpainSri LankaSt. Kitts and NevisSt. LuciaSt. Vincent and the GrenadinesSub-Saharan Africa Sub-Saharan Africa (excluding high income)Sub-Saharan Africa (IDA & IBRD countries)SudanSurinameSwazilandSwedenSwitzerlandSyrian Arab RepublicTajikistanTanzaniaThailandTimor-LesteTogoTongaTrinidad and TobagoTunisiaTurkeyTurkmenistanTurks and Caicos IslandsTuvaluUgandaUkraineUnited Arab EmiratesUnited KingdomUnited StatesUpper middle incomeUruguayUzbekistanVanuatuVenezuela, RBVietnamVirgin Islands (U.S.)West Bank and GazaWorldYemen, Rep.ZambiaZimbabwe Linha do tempo:
Nesta escala de tempo está apresentado um gráfico de 1961 ano até 2016 ano Spain. Dados de 1960 ano ausente. O número de observações reais por data: 56.
Fonte (nome):
Indicadores de desenvolvimento mundial
Fonte (organização):
World Bank Staff estimates based on United Nations, World Urbanization Prospects.
Categorias:
Agriculture & Rural Development
Foi atualizado:
23 abr 2017 ano
Indicadores de alterações dos valores ao longo dos anos
Mínimo:
20.421
1 jan 2016 ano
Máximo:
43.433
1 jan 1961 ano
Na data de observação
Valor
Mudança absoluta
A alteração em relação ao valor anterior
1 jan 1961 ano
43.433
+43.433
0.0%
1 jan 1962 ano
42.697
-0.736
-1.69%
1 jan 1963 ano
41.692
-1.005
-2.35%
1 jan 1964 ano
40.694
-0.998
-2.39%
1 jan 1965 ano
39.702
-0.992
-2.44%
1 jan 1966 ano
38.722
-0.98
-2.47%
1 jan 1967 ano
37.749
-0.973
-2.51%
1 jan 1968 ano
36.786
-0.963
-2.55%
1 jan 1969 ano
35.832
-0.954
-2.59%
1 jan 1970 ano
34.892
-0.94
-2.62%
1 jan 1971 ano
33.962
-0.93
-2.67%
1 jan 1972 ano
33.152
-0.81
-2.39%
1 jan 1973 ano
32.459
-0.693
-2.09%
1 jan 1974 ano
31.776
-0.683
-2.1%
1 jan 1975 ano
31.099
-0.677
-2.13%
1 jan 1976 ano
30.43
-0.669
-2.15%
1 jan 1977 ano
29.769
-0.661
-2.17%
1 jan 1978 ano
29.117
-0.652
-2.19%
1 jan 1979 ano
28.473
-0.644
-2.21%
1 jan 1980 ano
27.838
-0.635
-2.23%
1 jan 1981 ano
27.211
-0.627
-2.25%
1 jan 1982 ano
26.721
-0.49
-1.8%
1 jan 1983 ano
26.485
-0.236
-0.88%
1 jan 1984 ano
26.251
-0.234
-0.88%
1 jan 1985 ano
26.018
-0.233
-0.89%
1 jan 1986 ano
25.787
-0.231
-0.89%
1 jan 1987 ano
25.556
-0.231
-0.9%
1 jan 1988 ano
25.327
-0.229
-0.9%
1 jan 1989 ano
25.1
-0.227
-0.9%
1 jan 1990 ano
24.874
-0.226
-0.9%
1 jan 1991 ano
24.649
-0.225
-0.9%
1 jan 1992 ano
24.472
-0.177
-0.72%
1 jan 1993 ano
24.39
-0.082
-0.34%
1 jan 1994 ano
24.308
-0.082
-0.34%
1 jan 1995 ano
24.226
-0.082
-0.34%
1 jan 1996 ano
24.144
-0.082
-0.34%
1 jan 1997 ano
24.062
-0.082
-0.34%
1 jan 1998 ano
23.981
-0.081
-0.34%
1 jan 1999 ano
23.9
-0.081
-0.34%
1 jan 2000 ano
23.819
-0.081
-0.34%
1 jan 2001 ano
23.738
-0.081
-0.34%
1 jan 2002 ano
23.657
-0.081
-0.34%
1 jan 2003 ano
23.467
-0.19
-0.8%
1 jan 2004 ano
23.222
-0.245
-1.04%
1 jan 2005 ano
22.978
-0.244
-1.05%
1 jan 2006 ano
22.737
-0.241
-1.05%
1 jan 2007 ano
22.498
-0.239
-1.05%
1 jan 2008 ano
22.26
-0.238
-1.06%
1 jan 2009 ano
22.024
-0.236
-1.06%
1 jan 2010 ano
21.79
-0.234
-1.06%
1 jan 2011 ano
21.558
-0.232
-1.06%
1 jan 2012 ano
21.327
-0.231
-1.07%
1 jan 2013 ano
21.098
-0.229
-1.07%
1 jan 2014 ano
20.871
-0.227
-1.08%
1 jan 2015 ano
20.645
-0.226
-1.08%
1 jan 2016 ano
20.421
-0.224
-1.09%
Classificação de países por estatísticas atuais por anos


Comentários: