29
/pt/
pt
AIzaSyAYiBZKx7MnpbEhh9jyipgxe19OcubqV5w
April 1, 2024
222885
Peru
PER
true
2
1
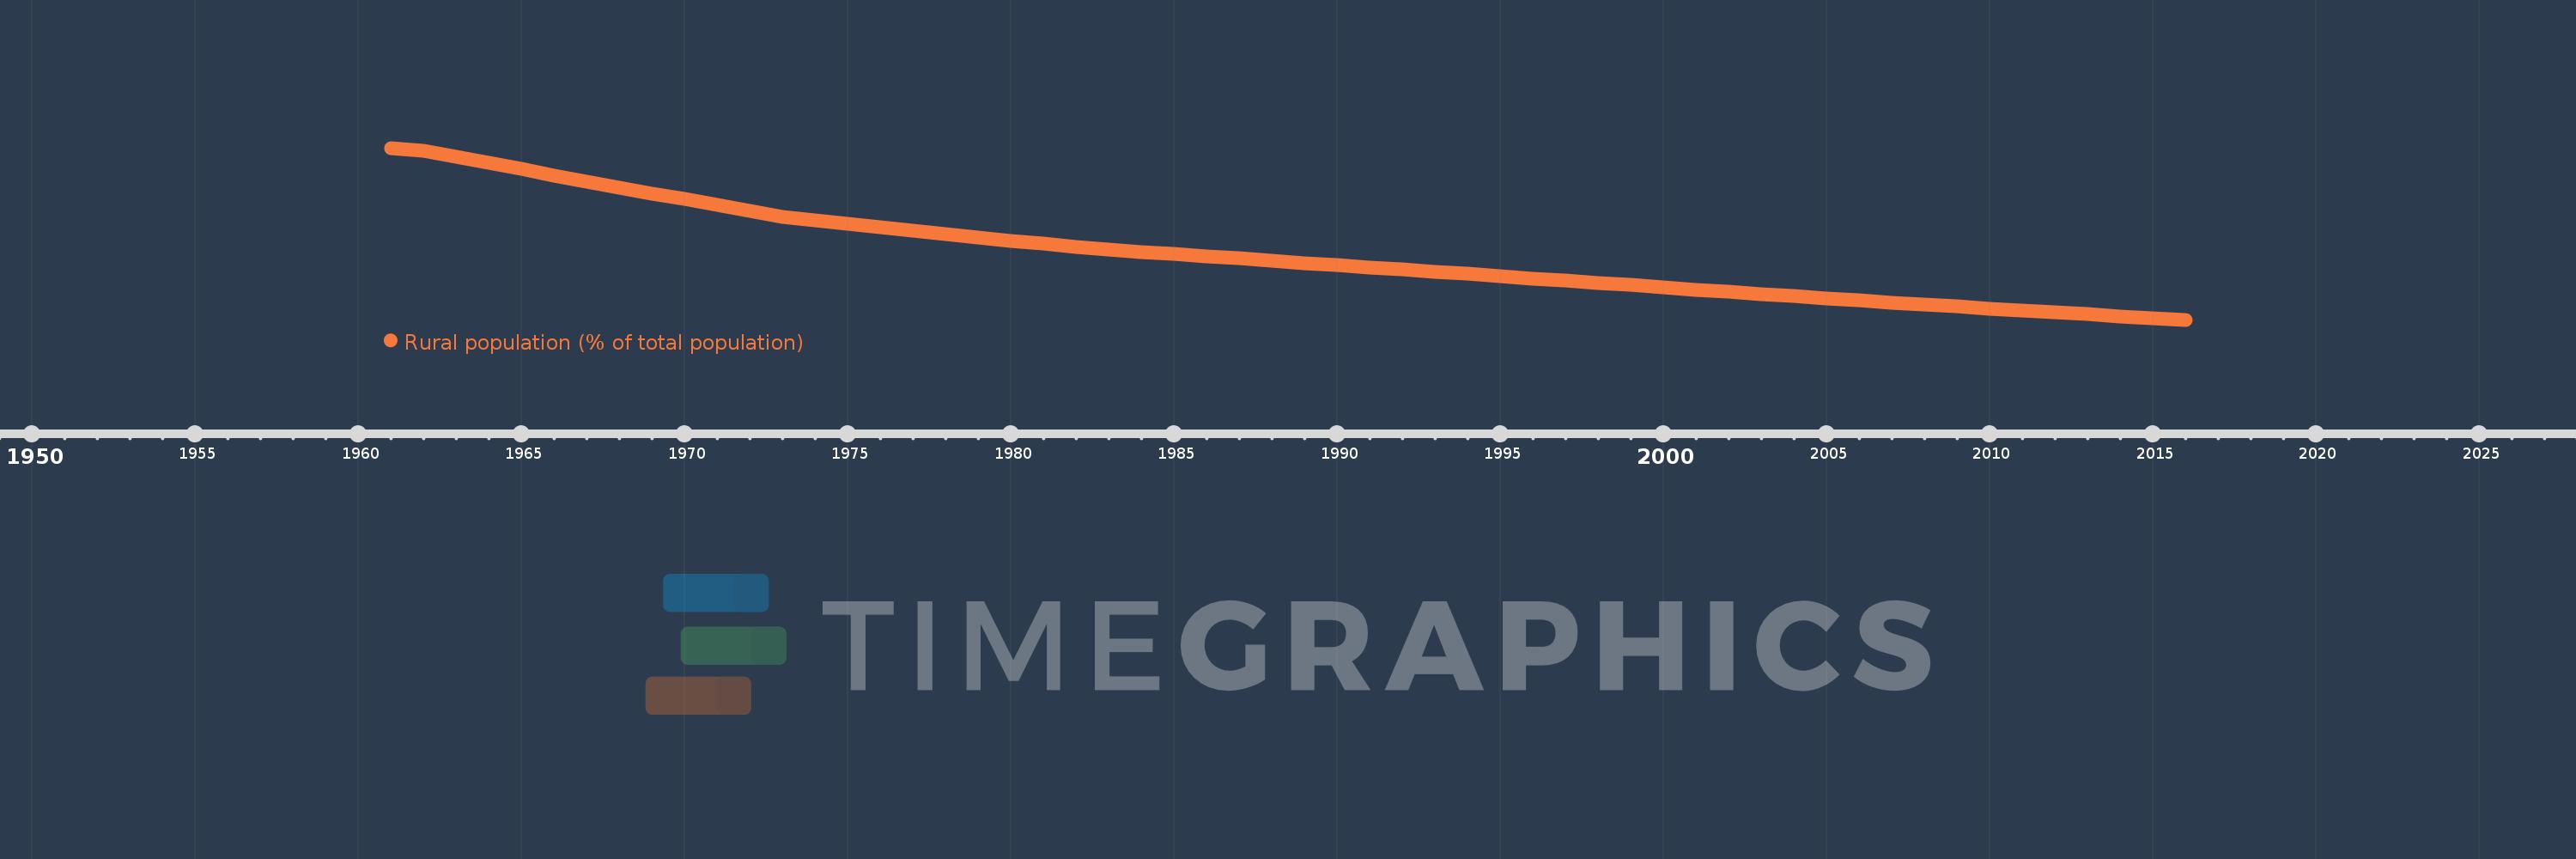
Rural population (% of total population)
2016,2015,2014,2013,2012,2011,2010,2009,2008,2007,2006,2005,2004,2003,2002,2001,2000,1999,1998,1997,1996,1995,1994,1993,1992,1991,1990,1989,1988,1987,1986,1985,1984,1983,1982,1981,1980,1979,1978,1977,1976,1975,1974,1973,1972,1971,1970,1969,1968,1967,1966,1965,1964,1963,1962,1961
Estas estatísticas em outros países:
AfghanistanAlbaniaAlgeriaAmerican SamoaAndorraAngolaAntigua and BarbudaArab WorldArgentinaArmeniaArubaAustraliaAustriaAzerbaijanBahamas, TheBahrainBangladeshBarbadosBelarusBelgiumBelizeBeninBermudaBhutanBoliviaBosnia and HerzegovinaBotswanaBrazilBritish Virgin IslandsBrunei DarussalamBulgariaBurkina FasoBurundiCabo VerdeCambodiaCameroonCanadaCaribbean small statesCayman IslandsCentral African RepublicCentral Europe and the BalticsChadChannel IslandsChileChinaColombiaComorosCongo, Dem. Rep.Congo, Rep.Costa RicaCote d'IvoireCroatiaCubaCuracaoCyprusCzech RepublicDenmarkDjiboutiDominicaDominican RepublicEarly-demographic dividendEast Asia & PacificEast Asia & Pacific (excluding high income)East Asia & Pacific (IDA & IBRD countries)EcuadorEgypt, Arab Rep.El SalvadorEquatorial GuineaEritreaEstoniaEthiopiaEuro areaEurope & Central AsiaEurope & Central Asia (excluding high income)Europe & Central Asia (IDA & IBRD countries)European UnionFaroe IslandsFijiFinlandFragile and conflict affected situationsFranceFrench PolynesiaGabonGambia, TheGeorgiaGermanyGhanaGibraltarGreeceGreenlandGrenadaGuamGuatemalaGuineaGuinea-BissauGuyanaHaitiHeavily indebted poor countries (HIPC)High incomeHondurasHong Kong SAR, ChinaHungaryIBRD onlyIcelandIDA & IBRD totalIDA blendIDA onlyIDA totalIndiaIndonesiaIran, Islamic Rep.IraqIrelandIsle of ManIsraelItalyJamaicaJapanJordanKazakhstanKenyaKiribatiKorea, Dem. People’s Rep.Korea, Rep.KuwaitKyrgyz RepublicLao PDRLate-demographic dividendLatin America & Caribbean Latin America & Caribbean (excluding high income)Latin America & the Caribbean (IDA & IBRD countries)LatviaLeast developed countries: UN classificationLebanonLesothoLiberiaLibyaLiechtensteinLithuaniaLow & middle incomeLow incomeLower middle incomeLuxembourgMacao SAR, ChinaMacedonia, FYRMadagascarMalawiMalaysiaMaldivesMaliMaltaMarshall IslandsMauritaniaMauritiusMexicoMicronesia, Fed. Sts.Middle East & North AfricaMiddle East & North Africa (excluding high income)Middle East & North Africa (IDA & IBRD countries)Middle incomeMoldovaMonacoMongoliaMontenegroMoroccoMozambiqueMyanmarNamibiaNauruNepalNetherlandsNew CaledoniaNew ZealandNicaraguaNigerNigeriaNorth AmericaNorthern Mariana IslandsNorwayOECD membersOmanOther small statesPacific island small statesPakistanPalauPanamaPapua New GuineaParaguayPeruPhilippinesPolandPortugalPost-demographic dividendPre-demographic dividendPuerto RicoQatarRomaniaRussian FederationRwandaSamoaSan MarinoSao Tome and PrincipeSaudi ArabiaSenegalSerbiaSeychellesSierra LeoneSingaporeSint Maarten (Dutch part)Slovak RepublicSloveniaSmall statesSolomon IslandsSomaliaSouth AfricaSouth AsiaSouth Asia (IDA & IBRD)South SudanSpainSri LankaSt. Kitts and NevisSt. LuciaSt. Vincent and the GrenadinesSub-Saharan Africa Sub-Saharan Africa (excluding high income)Sub-Saharan Africa (IDA & IBRD countries)SudanSurinameSwazilandSwedenSwitzerlandSyrian Arab RepublicTajikistanTanzaniaThailandTimor-LesteTogoTongaTrinidad and TobagoTunisiaTurkeyTurkmenistanTurks and Caicos IslandsTuvaluUgandaUkraineUnited Arab EmiratesUnited KingdomUnited StatesUpper middle incomeUruguayUzbekistanVanuatuVenezuela, RBVietnamVirgin Islands (U.S.)West Bank and GazaWorldYemen, Rep.ZambiaZimbabwe Linha do tempo:
Nesta escala de tempo está apresentado um gráfico de 1961 ano até 2016 ano Peru. Dados de 1960 ano ausente. O número de observações reais por data: 56.
Fonte (nome):
Indicadores de desenvolvimento mundial
Fonte (organização):
World Bank Staff estimates based on United Nations, World Urbanization Prospects.
Categorias:
Agriculture & Rural Development
Foi atualizado:
23 abr 2017 ano
Indicadores de alterações dos valores ao longo dos anos
Mínimo:
21.391
1 jan 2016 ano
Máximo:
53.189
1 jan 1961 ano
Na data de observação
Valor
Mudança absoluta
A alteração em relação ao valor anterior
1 jan 1961 ano
53.189
+53.189
0.0%
1 jan 1962 ano
52.602
-0.587
-1.1%
1 jan 1963 ano
51.486
-1.116
-2.12%
1 jan 1964 ano
50.368
-1.118
-2.17%
1 jan 1965 ano
49.248
-1.12
-2.22%
1 jan 1966 ano
48.132
-1.116
-2.27%
1 jan 1967 ano
47.017
-1.115
-2.32%
1 jan 1968 ano
45.904
-1.113
-2.37%
1 jan 1969 ano
44.793
-1.111
-2.42%
1 jan 1970 ano
43.691
-1.102
-2.46%
1 jan 1971 ano
42.594
-1.097
-2.51%
1 jan 1972 ano
41.504
-1.09
-2.56%
1 jan 1973 ano
40.453
-1.051
-2.53%
1 jan 1974 ano
39.812
-0.641
-1.58%
1 jan 1975 ano
39.173
-0.639
-1.61%
1 jan 1976 ano
38.539
-0.634
-1.62%
1 jan 1977 ano
37.907
-0.632
-1.64%
1 jan 1978 ano
37.281
-0.626
-1.65%
1 jan 1979 ano
36.659
-0.622
-1.67%
1 jan 1980 ano
36.04
-0.619
-1.69%
1 jan 1981 ano
35.426
-0.614
-1.7%
1 jan 1982 ano
34.818
-0.608
-1.72%
1 jan 1983 ano
34.39
-0.428
-1.23%
1 jan 1984 ano
33.969
-0.421
-1.22%
1 jan 1985 ano
33.551
-0.418
-1.23%
1 jan 1986 ano
33.136
-0.415
-1.24%
1 jan 1987 ano
32.723
-0.413
-1.25%
1 jan 1988 ano
32.313
-0.41
-1.25%
1 jan 1989 ano
31.905
-0.408
-1.26%
1 jan 1990 ano
31.501
-0.404
-1.27%
1 jan 1991 ano
31.099
-0.402
-1.28%
1 jan 1992 ano
30.7
-0.399
-1.28%
1 jan 1993 ano
30.303
-0.397
-1.29%
1 jan 1994 ano
29.911
-0.392
-1.29%
1 jan 1995 ano
29.479
-0.432
-1.44%
1 jan 1996 ano
29.049
-0.43
-1.46%
1 jan 1997 ano
28.623
-0.426
-1.47%
1 jan 1998 ano
28.202
-0.421
-1.47%
1 jan 1999 ano
27.784
-0.418
-1.48%
1 jan 2000 ano
27.369
-0.415
-1.49%
1 jan 2001 ano
26.958
-0.411
-1.5%
1 jan 2002 ano
26.552
-0.406
-1.51%
1 jan 2003 ano
26.15
-0.402
-1.51%
1 jan 2004 ano
25.751
-0.399
-1.53%
1 jan 2005 ano
25.356
-0.395
-1.53%
1 jan 2006 ano
24.966
-0.39
-1.54%
1 jan 2007 ano
24.579
-0.387
-1.55%
1 jan 2008 ano
24.197
-0.382
-1.55%
1 jan 2009 ano
23.818
-0.379
-1.57%
1 jan 2010 ano
23.448
-0.37
-1.55%
1 jan 2011 ano
23.085
-0.363
-1.55%
1 jan 2012 ano
22.731
-0.354
-1.53%
1 jan 2013 ano
22.384
-0.347
-1.53%
1 jan 2014 ano
22.046
-0.338
-1.51%
1 jan 2015 ano
21.715
-0.331
-1.5%
1 jan 2016 ano
21.391
-0.324
-1.49%
Classificação de países por estatísticas atuais por anos


Comentários: