29
/pt/
pt
AIzaSyAYiBZKx7MnpbEhh9jyipgxe19OcubqV5w
April 1, 2024
217125
Pakistan
PAK
true
2
1
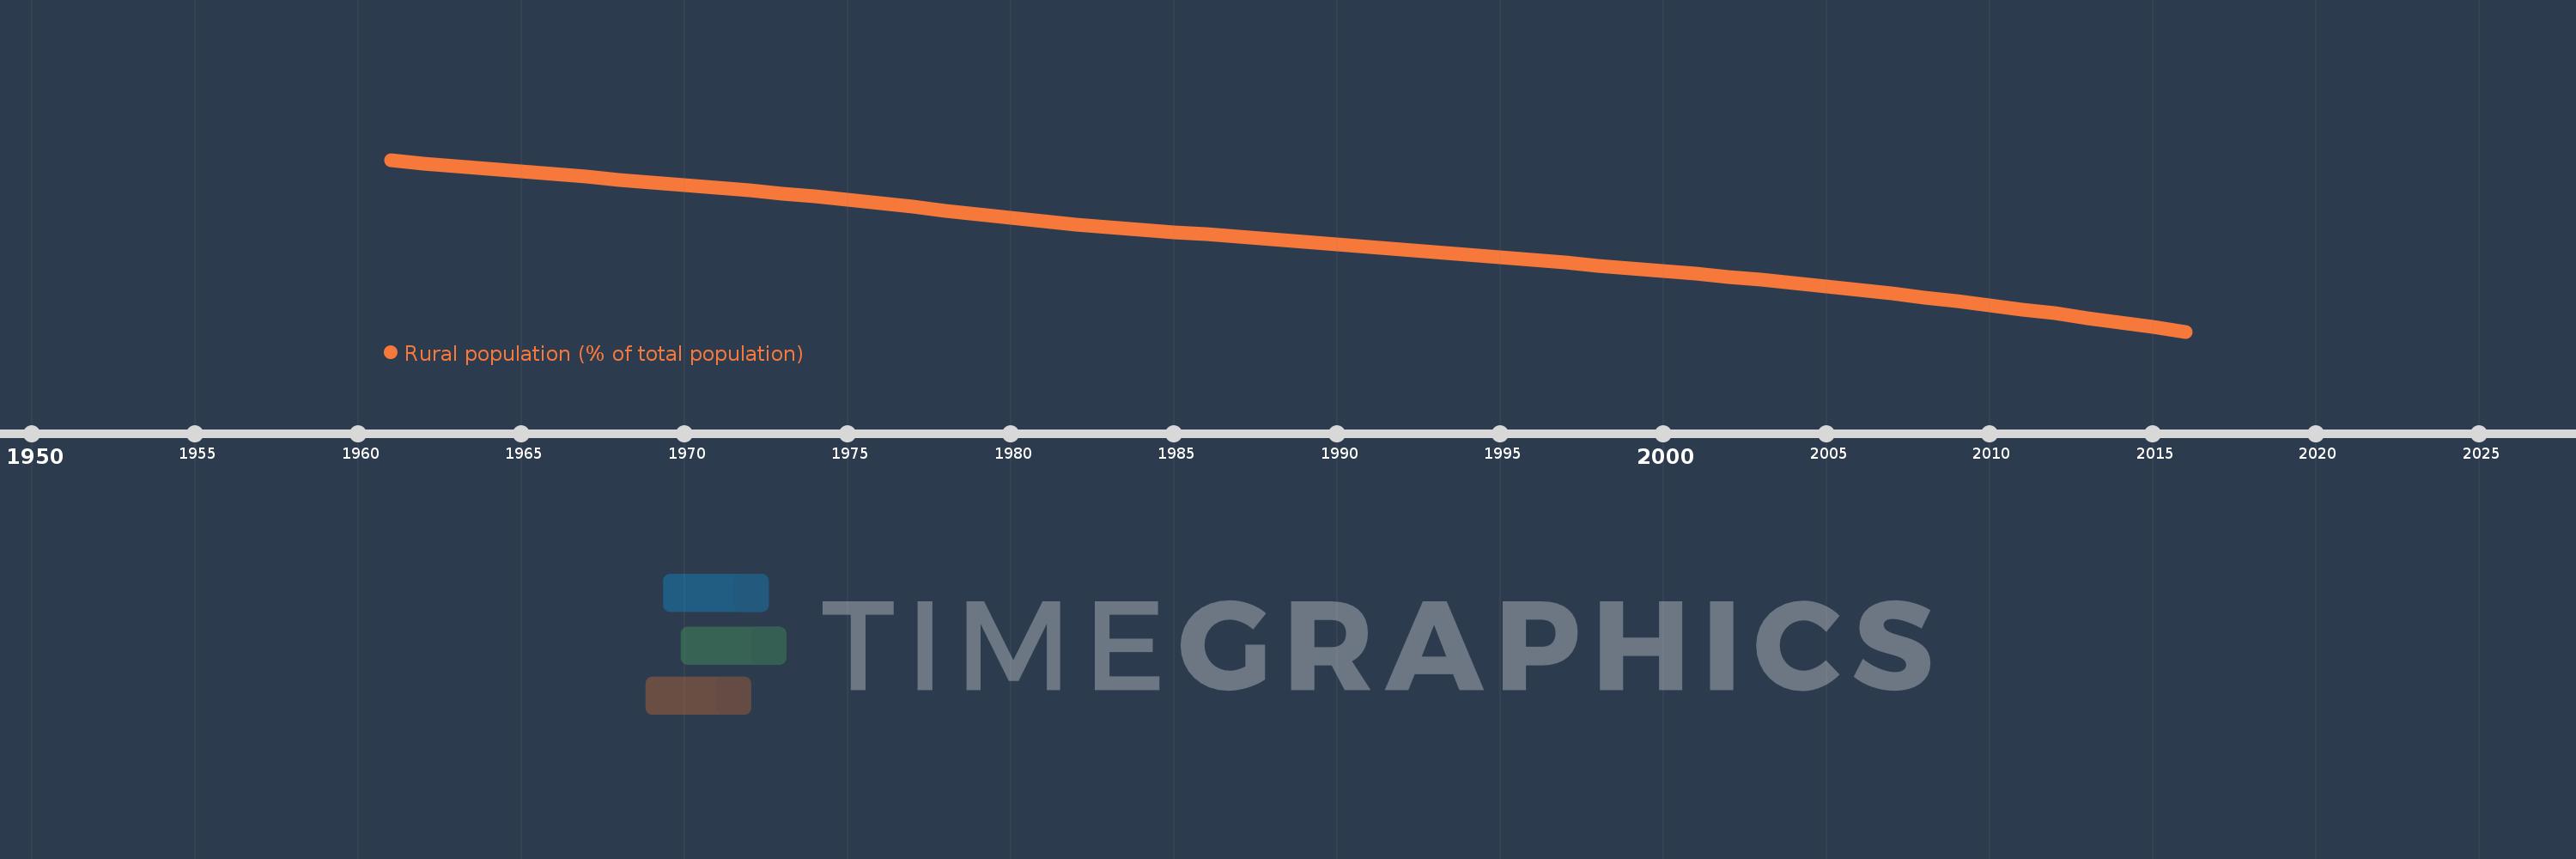
Rural population (% of total population)
2016,2015,2014,2013,2012,2011,2010,2009,2008,2007,2006,2005,2004,2003,2002,2001,2000,1999,1998,1997,1996,1995,1994,1993,1992,1991,1990,1989,1988,1987,1986,1985,1984,1983,1982,1981,1980,1979,1978,1977,1976,1975,1974,1973,1972,1971,1970,1969,1968,1967,1966,1965,1964,1963,1962,1961
Estas estatísticas em outros países:
AfghanistanAlbaniaAlgeriaAmerican SamoaAndorraAngolaAntigua and BarbudaArab WorldArgentinaArmeniaArubaAustraliaAustriaAzerbaijanBahamas, TheBahrainBangladeshBarbadosBelarusBelgiumBelizeBeninBermudaBhutanBoliviaBosnia and HerzegovinaBotswanaBrazilBritish Virgin IslandsBrunei DarussalamBulgariaBurkina FasoBurundiCabo VerdeCambodiaCameroonCanadaCaribbean small statesCayman IslandsCentral African RepublicCentral Europe and the BalticsChadChannel IslandsChileChinaColombiaComorosCongo, Dem. Rep.Congo, Rep.Costa RicaCote d'IvoireCroatiaCubaCuracaoCyprusCzech RepublicDenmarkDjiboutiDominicaDominican RepublicEarly-demographic dividendEast Asia & PacificEast Asia & Pacific (excluding high income)East Asia & Pacific (IDA & IBRD countries)EcuadorEgypt, Arab Rep.El SalvadorEquatorial GuineaEritreaEstoniaEthiopiaEuro areaEurope & Central AsiaEurope & Central Asia (excluding high income)Europe & Central Asia (IDA & IBRD countries)European UnionFaroe IslandsFijiFinlandFragile and conflict affected situationsFranceFrench PolynesiaGabonGambia, TheGeorgiaGermanyGhanaGibraltarGreeceGreenlandGrenadaGuamGuatemalaGuineaGuinea-BissauGuyanaHaitiHeavily indebted poor countries (HIPC)High incomeHondurasHong Kong SAR, ChinaHungaryIBRD onlyIcelandIDA & IBRD totalIDA blendIDA onlyIDA totalIndiaIndonesiaIran, Islamic Rep.IraqIrelandIsle of ManIsraelItalyJamaicaJapanJordanKazakhstanKenyaKiribatiKorea, Dem. People’s Rep.Korea, Rep.KuwaitKyrgyz RepublicLao PDRLate-demographic dividendLatin America & Caribbean Latin America & Caribbean (excluding high income)Latin America & the Caribbean (IDA & IBRD countries)LatviaLeast developed countries: UN classificationLebanonLesothoLiberiaLibyaLiechtensteinLithuaniaLow & middle incomeLow incomeLower middle incomeLuxembourgMacao SAR, ChinaMacedonia, FYRMadagascarMalawiMalaysiaMaldivesMaliMaltaMarshall IslandsMauritaniaMauritiusMexicoMicronesia, Fed. Sts.Middle East & North AfricaMiddle East & North Africa (excluding high income)Middle East & North Africa (IDA & IBRD countries)Middle incomeMoldovaMonacoMongoliaMontenegroMoroccoMozambiqueMyanmarNamibiaNauruNepalNetherlandsNew CaledoniaNew ZealandNicaraguaNigerNigeriaNorth AmericaNorthern Mariana IslandsNorwayOECD membersOmanOther small statesPacific island small statesPakistanPalauPanamaPapua New GuineaParaguayPeruPhilippinesPolandPortugalPost-demographic dividendPre-demographic dividendPuerto RicoQatarRomaniaRussian FederationRwandaSamoaSan MarinoSao Tome and PrincipeSaudi ArabiaSenegalSerbiaSeychellesSierra LeoneSingaporeSint Maarten (Dutch part)Slovak RepublicSloveniaSmall statesSolomon IslandsSomaliaSouth AfricaSouth AsiaSouth Asia (IDA & IBRD)South SudanSpainSri LankaSt. Kitts and NevisSt. LuciaSt. Vincent and the GrenadinesSub-Saharan Africa Sub-Saharan Africa (excluding high income)Sub-Saharan Africa (IDA & IBRD countries)SudanSurinameSwazilandSwedenSwitzerlandSyrian Arab RepublicTajikistanTanzaniaThailandTimor-LesteTogoTongaTrinidad and TobagoTunisiaTurkeyTurkmenistanTurks and Caicos IslandsTuvaluUgandaUkraineUnited Arab EmiratesUnited KingdomUnited StatesUpper middle incomeUruguayUzbekistanVanuatuVenezuela, RBVietnamVirgin Islands (U.S.)West Bank and GazaWorldYemen, Rep.ZambiaZimbabwe Linha do tempo:
Nesta escala de tempo está apresentado um gráfico de 1961 ano até 2016 ano Pakistan. Dados de 1960 ano ausente. O número de observações reais por data: 56.
Fonte (nome):
Indicadores de desenvolvimento mundial
Fonte (organização):
World Bank Staff estimates based on United Nations, World Urbanization Prospects.
Categorias:
Agriculture & Rural Development
Foi atualizado:
23 abr 2017 ano
Indicadores de alterações dos valores ao longo dos anos
Mínimo:
61.242
1 jan 2016 ano
Máximo:
77.896
1 jan 1961 ano
Na data de observação
Valor
Mudança absoluta
A alteração em relação ao valor anterior
1 jan 1961 ano
77.896
+77.896
0.0%
1 jan 1962 ano
77.499
-0.397
-0.51%
1 jan 1963 ano
77.249
-0.25
-0.32%
1 jan 1964 ano
76.998
-0.251
-0.32%
1 jan 1965 ano
76.744
-0.254
-0.33%
1 jan 1966 ano
76.489
-0.255
-0.33%
1 jan 1967 ano
76.231
-0.258
-0.34%
1 jan 1968 ano
75.972
-0.259
-0.34%
1 jan 1969 ano
75.711
-0.261
-0.34%
1 jan 1970 ano
75.448
-0.263
-0.35%
1 jan 1971 ano
75.183
-0.265
-0.35%
1 jan 1972 ano
74.916
-0.267
-0.36%
1 jan 1973 ano
74.647
-0.269
-0.36%
1 jan 1974 ano
74.329
-0.318
-0.43%
1 jan 1975 ano
73.995
-0.334
-0.45%
1 jan 1976 ano
73.659
-0.336
-0.45%
1 jan 1977 ano
73.319
-0.34
-0.46%
1 jan 1978 ano
72.977
-0.342
-0.47%
1 jan 1979 ano
72.632
-0.345
-0.47%
1 jan 1980 ano
72.285
-0.347
-0.48%
1 jan 1981 ano
71.934
-0.351
-0.49%
1 jan 1982 ano
71.62
-0.314
-0.44%
1 jan 1983 ano
71.381
-0.239
-0.33%
1 jan 1984 ano
71.141
-0.24
-0.34%
1 jan 1985 ano
70.899
-0.242
-0.34%
1 jan 1986 ano
70.656
-0.243
-0.34%
1 jan 1987 ano
70.412
-0.244
-0.35%
1 jan 1988 ano
70.167
-0.245
-0.35%
1 jan 1989 ano
69.92
-0.247
-0.35%
1 jan 1990 ano
69.673
-0.247
-0.35%
1 jan 1991 ano
69.424
-0.249
-0.36%
1 jan 1992 ano
69.174
-0.25
-0.36%
1 jan 1993 ano
68.923
-0.251
-0.36%
1 jan 1994 ano
68.671
-0.252
-0.37%
1 jan 1995 ano
68.418
-0.253
-0.37%
1 jan 1996 ano
68.164
-0.254
-0.37%
1 jan 1997 ano
67.908
-0.256
-0.38%
1 jan 1998 ano
67.652
-0.256
-0.38%
1 jan 1999 ano
67.395
-0.257
-0.38%
1 jan 2000 ano
67.126
-0.269
-0.4%
1 jan 2001 ano
66.845
-0.281
-0.42%
1 jan 2002 ano
66.554
-0.291
-0.44%
1 jan 2003 ano
66.25
-0.304
-0.46%
1 jan 2004 ano
65.935
-0.315
-0.48%
1 jan 2005 ano
65.608
-0.327
-0.5%
1 jan 2006 ano
65.27
-0.338
-0.52%
1 jan 2007 ano
64.92
-0.35
-0.54%
1 jan 2008 ano
64.558
-0.362
-0.56%
1 jan 2009 ano
64.184
-0.374
-0.58%
1 jan 2010 ano
63.799
-0.385
-0.6%
1 jan 2011 ano
63.402
-0.397
-0.62%
1 jan 2012 ano
62.993
-0.409
-0.65%
1 jan 2013 ano
62.572
-0.421
-0.67%
1 jan 2014 ano
62.14
-0.432
-0.69%
1 jan 2015 ano
61.697
-0.443
-0.71%
1 jan 2016 ano
61.242
-0.455
-0.74%
Classificação de países por estatísticas atuais por anos


Comentários: