29
/pt/
pt
AIzaSyAYiBZKx7MnpbEhh9jyipgxe19OcubqV5w
April 1, 2024
65400
Albania
ALB
true
2
1
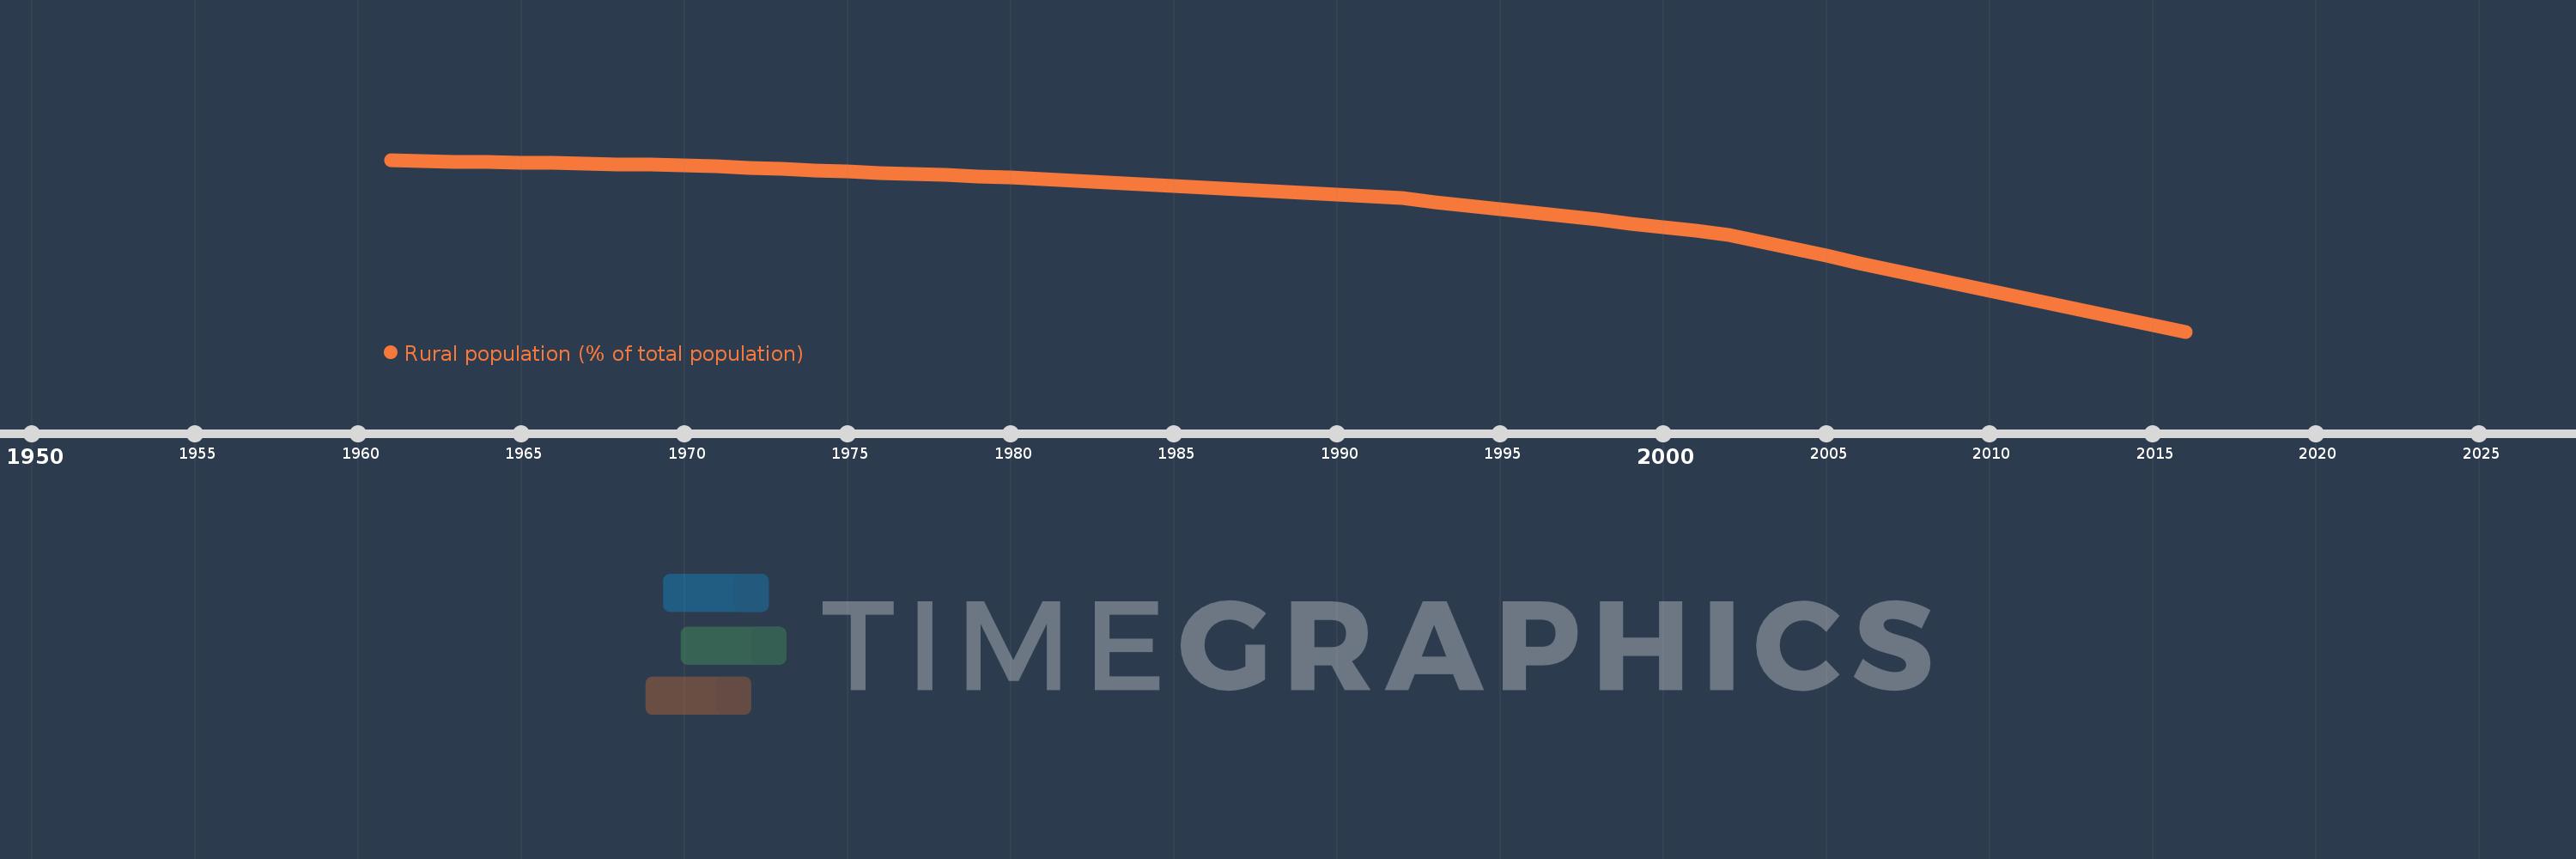
Rural population (% of total population)
2016,2015,2014,2013,2012,2011,2010,2009,2008,2007,2006,2005,2004,2003,2002,2001,2000,1999,1998,1997,1996,1995,1994,1993,1992,1991,1990,1989,1988,1987,1986,1985,1984,1983,1982,1981,1980,1979,1978,1977,1976,1975,1974,1973,1972,1971,1970,1969,1968,1967,1966,1965,1964,1963,1962,1961
Estas estatísticas em outros países:
AfghanistanAlbaniaAlgeriaAmerican SamoaAndorraAngolaAntigua and BarbudaArab WorldArgentinaArmeniaArubaAustraliaAustriaAzerbaijanBahamas, TheBahrainBangladeshBarbadosBelarusBelgiumBelizeBeninBermudaBhutanBoliviaBosnia and HerzegovinaBotswanaBrazilBritish Virgin IslandsBrunei DarussalamBulgariaBurkina FasoBurundiCabo VerdeCambodiaCameroonCanadaCaribbean small statesCayman IslandsCentral African RepublicCentral Europe and the BalticsChadChannel IslandsChileChinaColombiaComorosCongo, Dem. Rep.Congo, Rep.Costa RicaCote d'IvoireCroatiaCubaCuracaoCyprusCzech RepublicDenmarkDjiboutiDominicaDominican RepublicEarly-demographic dividendEast Asia & PacificEast Asia & Pacific (excluding high income)East Asia & Pacific (IDA & IBRD countries)EcuadorEgypt, Arab Rep.El SalvadorEquatorial GuineaEritreaEstoniaEthiopiaEuro areaEurope & Central AsiaEurope & Central Asia (excluding high income)Europe & Central Asia (IDA & IBRD countries)European UnionFaroe IslandsFijiFinlandFragile and conflict affected situationsFranceFrench PolynesiaGabonGambia, TheGeorgiaGermanyGhanaGibraltarGreeceGreenlandGrenadaGuamGuatemalaGuineaGuinea-BissauGuyanaHaitiHeavily indebted poor countries (HIPC)High incomeHondurasHong Kong SAR, ChinaHungaryIBRD onlyIcelandIDA & IBRD totalIDA blendIDA onlyIDA totalIndiaIndonesiaIran, Islamic Rep.IraqIrelandIsle of ManIsraelItalyJamaicaJapanJordanKazakhstanKenyaKiribatiKorea, Dem. People’s Rep.Korea, Rep.KuwaitKyrgyz RepublicLao PDRLate-demographic dividendLatin America & Caribbean Latin America & Caribbean (excluding high income)Latin America & the Caribbean (IDA & IBRD countries)LatviaLeast developed countries: UN classificationLebanonLesothoLiberiaLibyaLiechtensteinLithuaniaLow & middle incomeLow incomeLower middle incomeLuxembourgMacao SAR, ChinaMacedonia, FYRMadagascarMalawiMalaysiaMaldivesMaliMaltaMarshall IslandsMauritaniaMauritiusMexicoMicronesia, Fed. Sts.Middle East & North AfricaMiddle East & North Africa (excluding high income)Middle East & North Africa (IDA & IBRD countries)Middle incomeMoldovaMonacoMongoliaMontenegroMoroccoMozambiqueMyanmarNamibiaNauruNepalNetherlandsNew CaledoniaNew ZealandNicaraguaNigerNigeriaNorth AmericaNorthern Mariana IslandsNorwayOECD membersOmanOther small statesPacific island small statesPakistanPalauPanamaPapua New GuineaParaguayPeruPhilippinesPolandPortugalPost-demographic dividendPre-demographic dividendPuerto RicoQatarRomaniaRussian FederationRwandaSamoaSan MarinoSao Tome and PrincipeSaudi ArabiaSenegalSerbiaSeychellesSierra LeoneSingaporeSint Maarten (Dutch part)Slovak RepublicSloveniaSmall statesSolomon IslandsSomaliaSouth AfricaSouth AsiaSouth Asia (IDA & IBRD)South SudanSpainSri LankaSt. Kitts and NevisSt. LuciaSt. Vincent and the GrenadinesSub-Saharan Africa Sub-Saharan Africa (excluding high income)Sub-Saharan Africa (IDA & IBRD countries)SudanSurinameSwazilandSwedenSwitzerlandSyrian Arab RepublicTajikistanTanzaniaThailandTimor-LesteTogoTongaTrinidad and TobagoTunisiaTurkeyTurkmenistanTurks and Caicos IslandsTuvaluUgandaUkraineUnited Arab EmiratesUnited KingdomUnited StatesUpper middle incomeUruguayUzbekistanVanuatuVenezuela, RBVietnamVirgin Islands (U.S.)West Bank and GazaWorldYemen, Rep.ZambiaZimbabwe Linha do tempo:
Nesta escala de tempo está apresentado um gráfico de 1961 ano até 2016 ano Albania. Dados de 1960 ano ausente. O número de observações reais por data: 56.
Fonte (nome):
Indicadores de desenvolvimento mundial
Fonte (organização):
World Bank Staff estimates based on United Nations, World Urbanization Prospects.
Categorias:
Agriculture & Rural Development
Foi atualizado:
23 abr 2017 ano
Indicadores de alterações dos valores ao longo dos anos
Mínimo:
42.593
1 jan 2016 ano
Máximo:
69.295
1 jan 1961 ano
Na data de observação
Valor
Mudança absoluta
A alteração em relação ao valor anterior
1 jan 1961 ano
69.295
+69.295
0.0%
1 jan 1962 ano
69.057
-0.238
-0.34%
1 jan 1963 ano
68.985
-0.072
-0.1%
1 jan 1964 ano
68.914
-0.071
-0.1%
1 jan 1965 ano
68.842
-0.072
-0.1%
1 jan 1966 ano
68.77
-0.072
-0.1%
1 jan 1967 ano
68.698
-0.072
-0.1%
1 jan 1968 ano
68.626
-0.072
-0.1%
1 jan 1969 ano
68.554
-0.072
-0.1%
1 jan 1970 ano
68.452
-0.102
-0.15%
1 jan 1971 ano
68.26
-0.192
-0.28%
1 jan 1972 ano
68.067
-0.193
-0.28%
1 jan 1973 ano
67.873
-0.194
-0.29%
1 jan 1974 ano
67.679
-0.194
-0.29%
1 jan 1975 ano
67.484
-0.195
-0.29%
1 jan 1976 ano
67.288
-0.196
-0.29%
1 jan 1977 ano
67.092
-0.196
-0.29%
1 jan 1978 ano
66.895
-0.197
-0.29%
1 jan 1979 ano
66.698
-0.197
-0.29%
1 jan 1980 ano
66.5
-0.198
-0.3%
1 jan 1981 ano
66.238
-0.262
-0.39%
1 jan 1982 ano
65.976
-0.262
-0.4%
1 jan 1983 ano
65.713
-0.263
-0.4%
1 jan 1984 ano
65.448
-0.265
-0.4%
1 jan 1985 ano
65.183
-0.265
-0.4%
1 jan 1986 ano
64.917
-0.266
-0.41%
1 jan 1987 ano
64.65
-0.267
-0.41%
1 jan 1988 ano
64.381
-0.269
-0.42%
1 jan 1989 ano
64.112
-0.269
-0.42%
1 jan 1990 ano
63.842
-0.27
-0.42%
1 jan 1991 ano
63.572
-0.27
-0.42%
1 jan 1992 ano
63.3
-0.272
-0.43%
1 jan 1993 ano
62.751
-0.549
-0.87%
1 jan 1994 ano
62.201
-0.55
-0.88%
1 jan 1995 ano
61.646
-0.555
-0.89%
1 jan 1996 ano
61.089
-0.557
-0.9%
1 jan 1997 ano
60.527
-0.562
-0.92%
1 jan 1998 ano
59.965
-0.562
-0.93%
1 jan 1999 ano
59.399
-0.566
-0.94%
1 jan 2000 ano
58.831
-0.568
-0.96%
1 jan 2001 ano
58.259
-0.572
-0.97%
1 jan 2002 ano
57.565
-0.694
-1.19%
1 jan 2003 ano
56.499
-1.066
-1.85%
1 jan 2004 ano
55.427
-1.072
-1.9%
1 jan 2005 ano
54.349
-1.078
-1.94%
1 jan 2006 ano
53.269
-1.08
-1.99%
1 jan 2007 ano
52.185
-1.084
-2.03%
1 jan 2008 ano
51.098
-1.087
-2.08%
1 jan 2009 ano
50.009
-1.089
-2.13%
1 jan 2010 ano
48.924
-1.085
-2.17%
1 jan 2011 ano
47.837
-1.087
-2.22%
1 jan 2012 ano
46.753
-1.084
-2.27%
1 jan 2013 ano
45.67
-1.083
-2.32%
1 jan 2014 ano
44.617
-1.053
-2.31%
1 jan 2015 ano
43.591
-1.026
-2.3%
1 jan 2016 ano
42.593
-0.998
-2.29%
Classificação de países por estatísticas atuais por anos


Comentários: