29
/pt/
pt
AIzaSyAYiBZKx7MnpbEhh9jyipgxe19OcubqV5w
April 1, 2024
87044
Bolivia
BOL
true
2
1
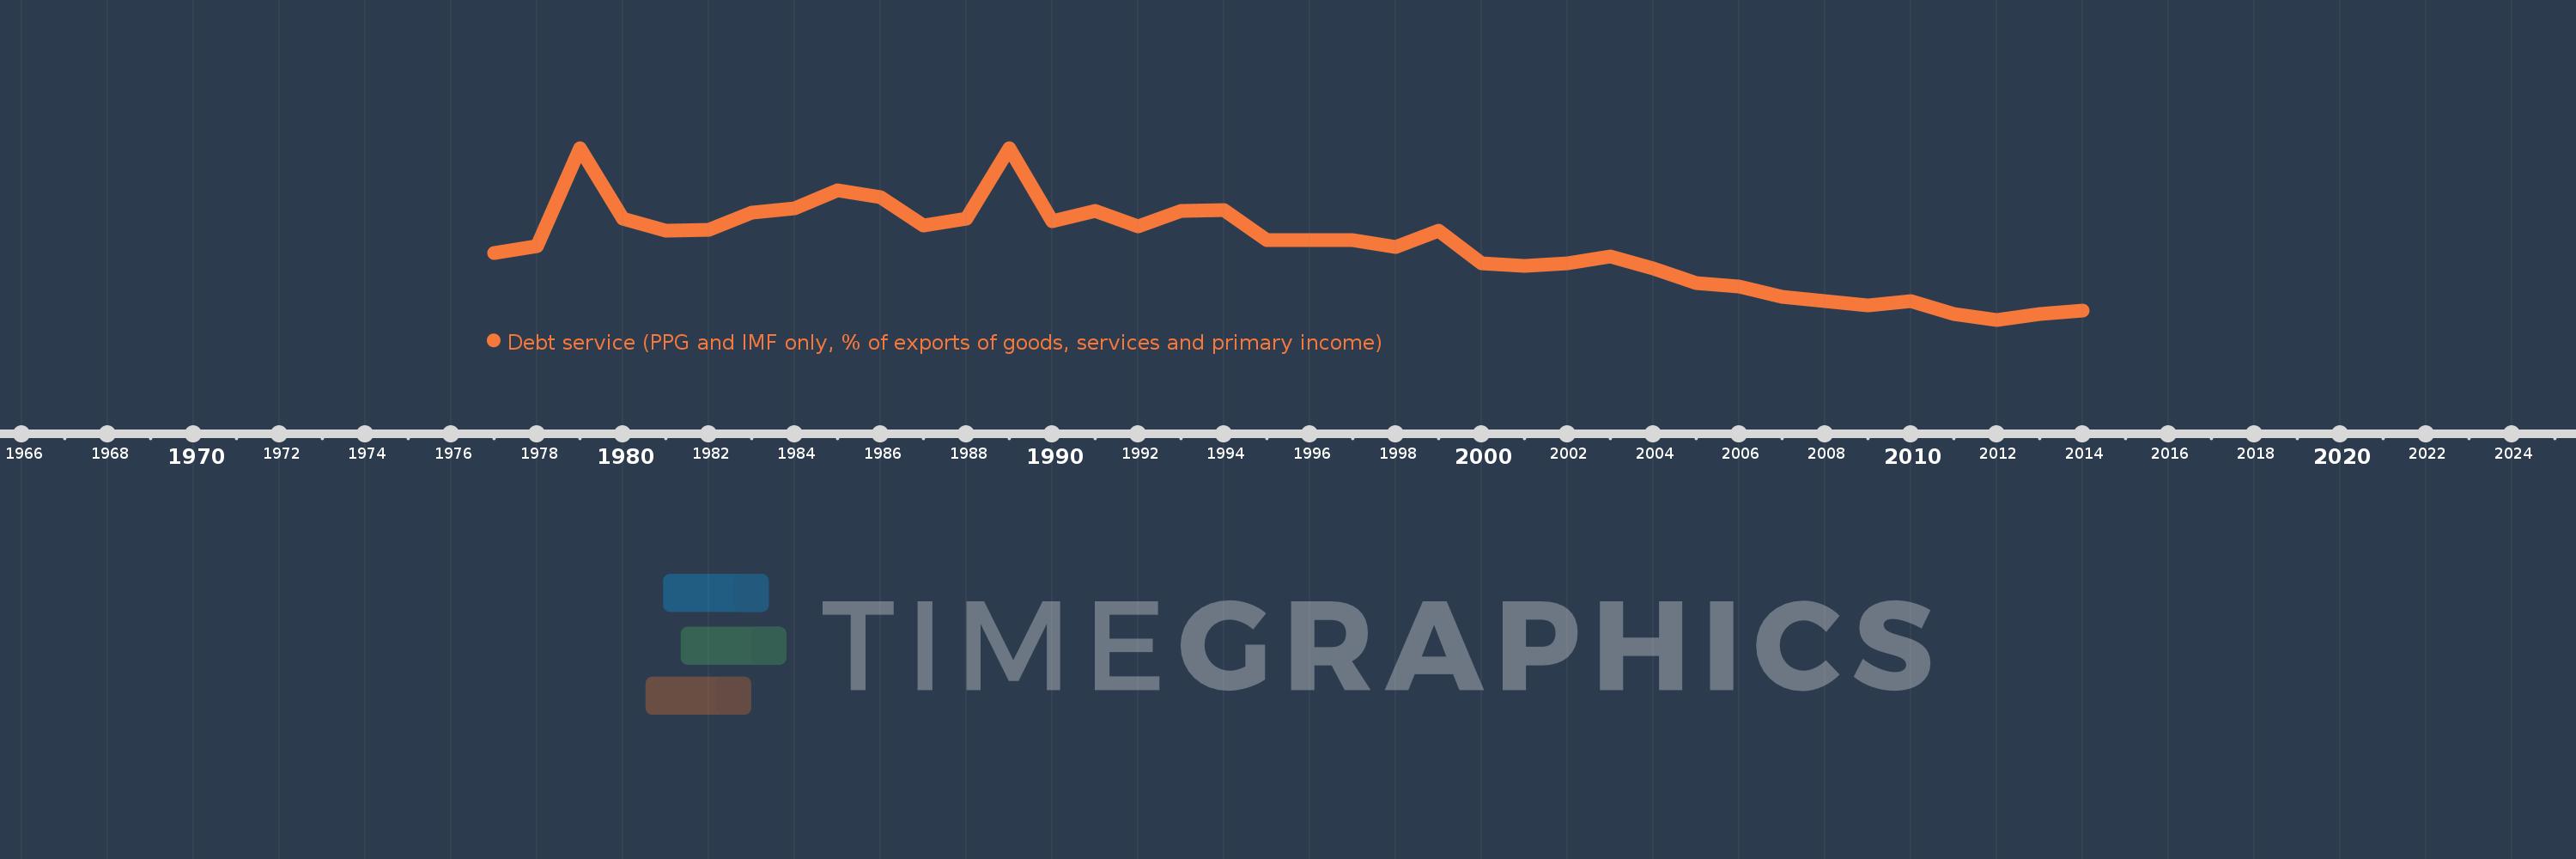
Debt service (PPG and IMF only, % of exports of goods, services and primary income)
2014,2013,2012,2011,2010,2009,2008,2007,2006,2005,2004,2003,2002,2001,2000,1999,1998,1997,1996,1995,1994,1993,1992,1991,1990,1989,1988,1987,1986,1985,1984,1983,1982,1981,1980,1979,1978,1977
Estas estatísticas em outros países:
Linha do tempo:
Nesta escala de tempo está apresentado um gráfico de 1977 ano até 2014 ano Bolivia. Dados de 1976 ano ausente. O número de observações reais por data: 38.
Fonte (nome):
Indicadores de desenvolvimento mundial
Fonte (organização):
World Bank, International Debt Statistics.
Categorias:
External Debt
Foi atualizado:
23 abr 2017 ano
Indicadores de alterações dos valores ao longo dos anos
Mínimo:
2.509
1 jan 2012 ano
Máximo:
52.579
1 jan 1989 ano
Na data de observação
Valor
Mudança absoluta
A alteração em relação ao valor anterior
1 jan 1977 ano
21.846
+21.846
0.0%
1 jan 1978 ano
23.898
+2.052
9.39%
1 jan 1979 ano
52.439
+28.541
119.43%
1 jan 1980 ano
31.922
-20.517
-39.13%
1 jan 1981 ano
28.489
-3.433
-10.75%
1 jan 1982 ano
28.83
+0.341
1.2%
1 jan 1983 ano
33.638
+4.809
16.68%
1 jan 1984 ano
35.008
+1.37
4.07%
1 jan 1985 ano
40.213
+5.205
14.87%
1 jan 1986 ano
38.324
-1.89
-4.7%
1 jan 1987 ano
29.964
-8.359
-21.81%
1 jan 1988 ano
32.009
+2.045
6.82%
1 jan 1989 ano
52.579
+20.57
64.26%
1 jan 1990 ano
31.214
-21.364
-40.63%
1 jan 1991 ano
34.171
+2.956
9.47%
1 jan 1992 ano
29.736
-4.435
-12.98%
1 jan 1993 ano
34.344
+4.608
15.5%
1 jan 1994 ano
34.382
+0.039
0.11%
1 jan 1995 ano
25.733
-8.649
-25.16%
1 jan 1996 ano
25.749
+0.016
0.06%
1 jan 1997 ano
25.607
-0.142
-0.55%
1 jan 1998 ano
23.775
-1.832
-7.15%
1 jan 1999 ano
28.577
+4.801
20.19%
1 jan 2000 ano
19.033
-9.544
-33.4%
1 jan 2001 ano
18.251
-0.781
-4.11%
1 jan 2002 ano
19.053
+0.801
4.39%
1 jan 2003 ano
21.079
+2.026
10.64%
1 jan 2004 ano
17.504
-3.575
-16.96%
1 jan 2005 ano
13.301
-4.203
-24.01%
1 jan 2006 ano
12.293
-1.008
-7.58%
1 jan 2007 ano
9.3
-2.993
-24.35%
1 jan 2008 ano
7.986
-1.315
-14.13%
1 jan 2009 ano
6.738
-1.248
-15.63%
1 jan 2010 ano
7.848
+1.111
16.49%
1 jan 2011 ano
4.21
-3.638
-46.36%
1 jan 2012 ano
2.509
-1.701
-40.4%
1 jan 2013 ano
4.153
+1.643
65.5%
1 jan 2014 ano
5.284
+1.131
27.24%
Classificação de países por estatísticas atuais por anos


Comentários: