29
/pt/
pt
AIzaSyAYiBZKx7MnpbEhh9jyipgxe19OcubqV5w
April 1, 2024
26406
Early-demographic dividend
EAR
false
2
1
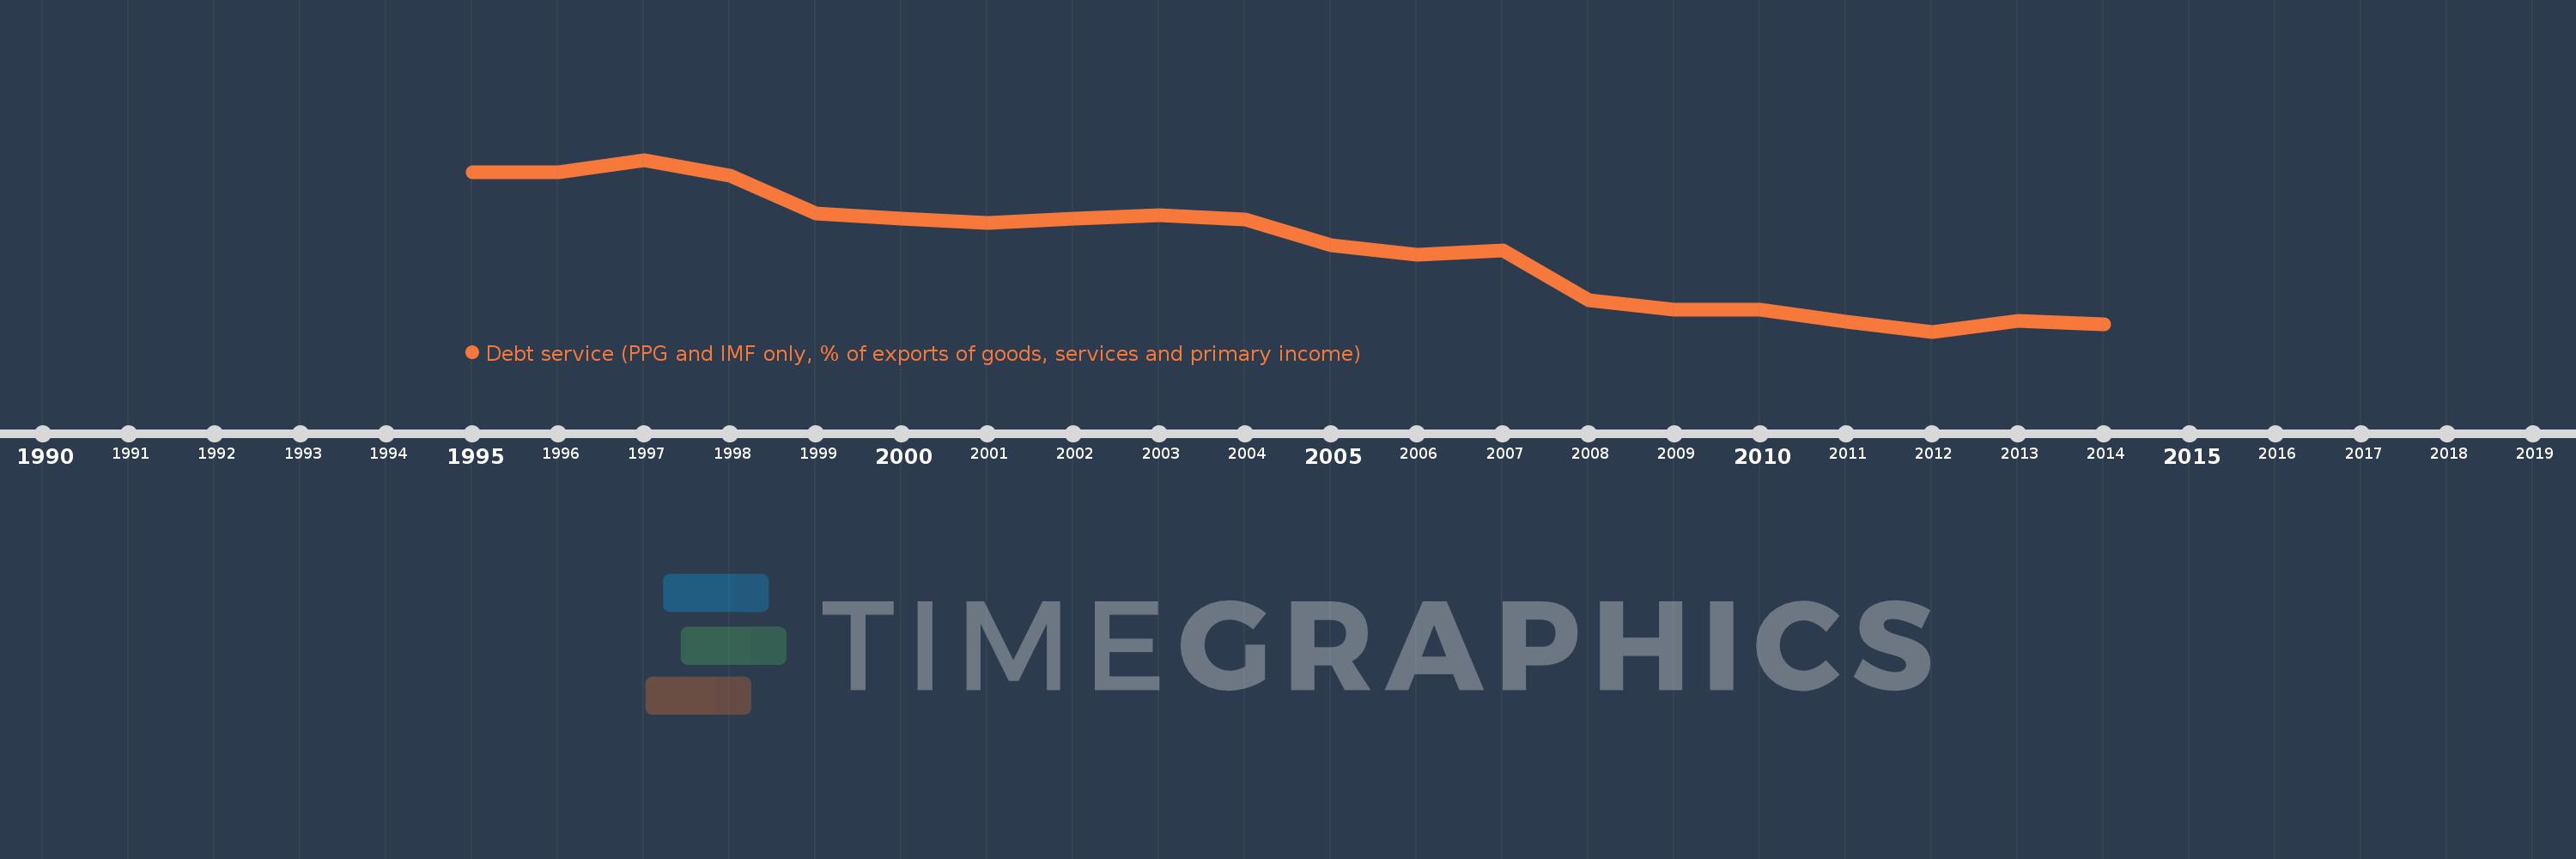
Debt service (PPG and IMF only, % of exports of goods, services and primary income)
2014,2013,2012,2011,2010,2009,2008,2007,2006,2005,2004,2003,2002,2001,2000,1999,1998,1997,1996,1995
Estas estatísticas em outros países:
Linha do tempo:
Nesta escala de tempo está apresentado um gráfico de 1995 ano até 2014 ano Early-demographic dividend. Dados de 1994 ano ausente. O número de observações reais por data: 20.
Fonte (nome):
Indicadores de desenvolvimento mundial
Fonte (organização):
World Bank, International Debt Statistics.
Categorias:
External Debt
Foi atualizado:
23 abr 2017 ano
Indicadores de alterações dos valores ao longo dos anos
Mínimo:
4.231
1 jan 2012 ano
Máximo:
18.699
1 jan 1997 ano
Na data de observação
Valor
Mudança absoluta
A alteração em relação ao valor anterior
1 jan 1995 ano
17.652
+17.652
0.0%
1 jan 1996 ano
17.676
+0.024
0.14%
1 jan 1997 ano
18.699
+1.023
5.79%
1 jan 1998 ano
17.344
-1.355
-7.25%
1 jan 1999 ano
14.191
-3.153
-18.18%
1 jan 2000 ano
13.744
-0.447
-3.15%
1 jan 2001 ano
13.353
-0.391
-2.84%
1 jan 2002 ano
13.751
+0.398
2.98%
1 jan 2003 ano
14.042
+0.291
2.12%
1 jan 2004 ano
13.678
-0.364
-2.59%
1 jan 2005 ano
11.478
-2.2
-16.08%
1 jan 2006 ano
10.686
-0.792
-6.9%
1 jan 2007 ano
11.07
+0.384
3.59%
1 jan 2008 ano
6.852
-4.218
-38.1%
1 jan 2009 ano
6.096
-0.756
-11.04%
1 jan 2010 ano
6.049
-0.046
-0.76%
1 jan 2011 ano
5.096
-0.954
-15.76%
1 jan 2012 ano
4.231
-0.864
-16.96%
1 jan 2013 ano
5.164
+0.932
22.03%
1 jan 2014 ano
4.813
-0.35
-6.79%
Classificação de países por estatísticas atuais por anos


Comentários: