29
/pt/
pt
AIzaSyAYiBZKx7MnpbEhh9jyipgxe19OcubqV5w
April 1, 2024
260718
Tanzania
TZA
true
2
1
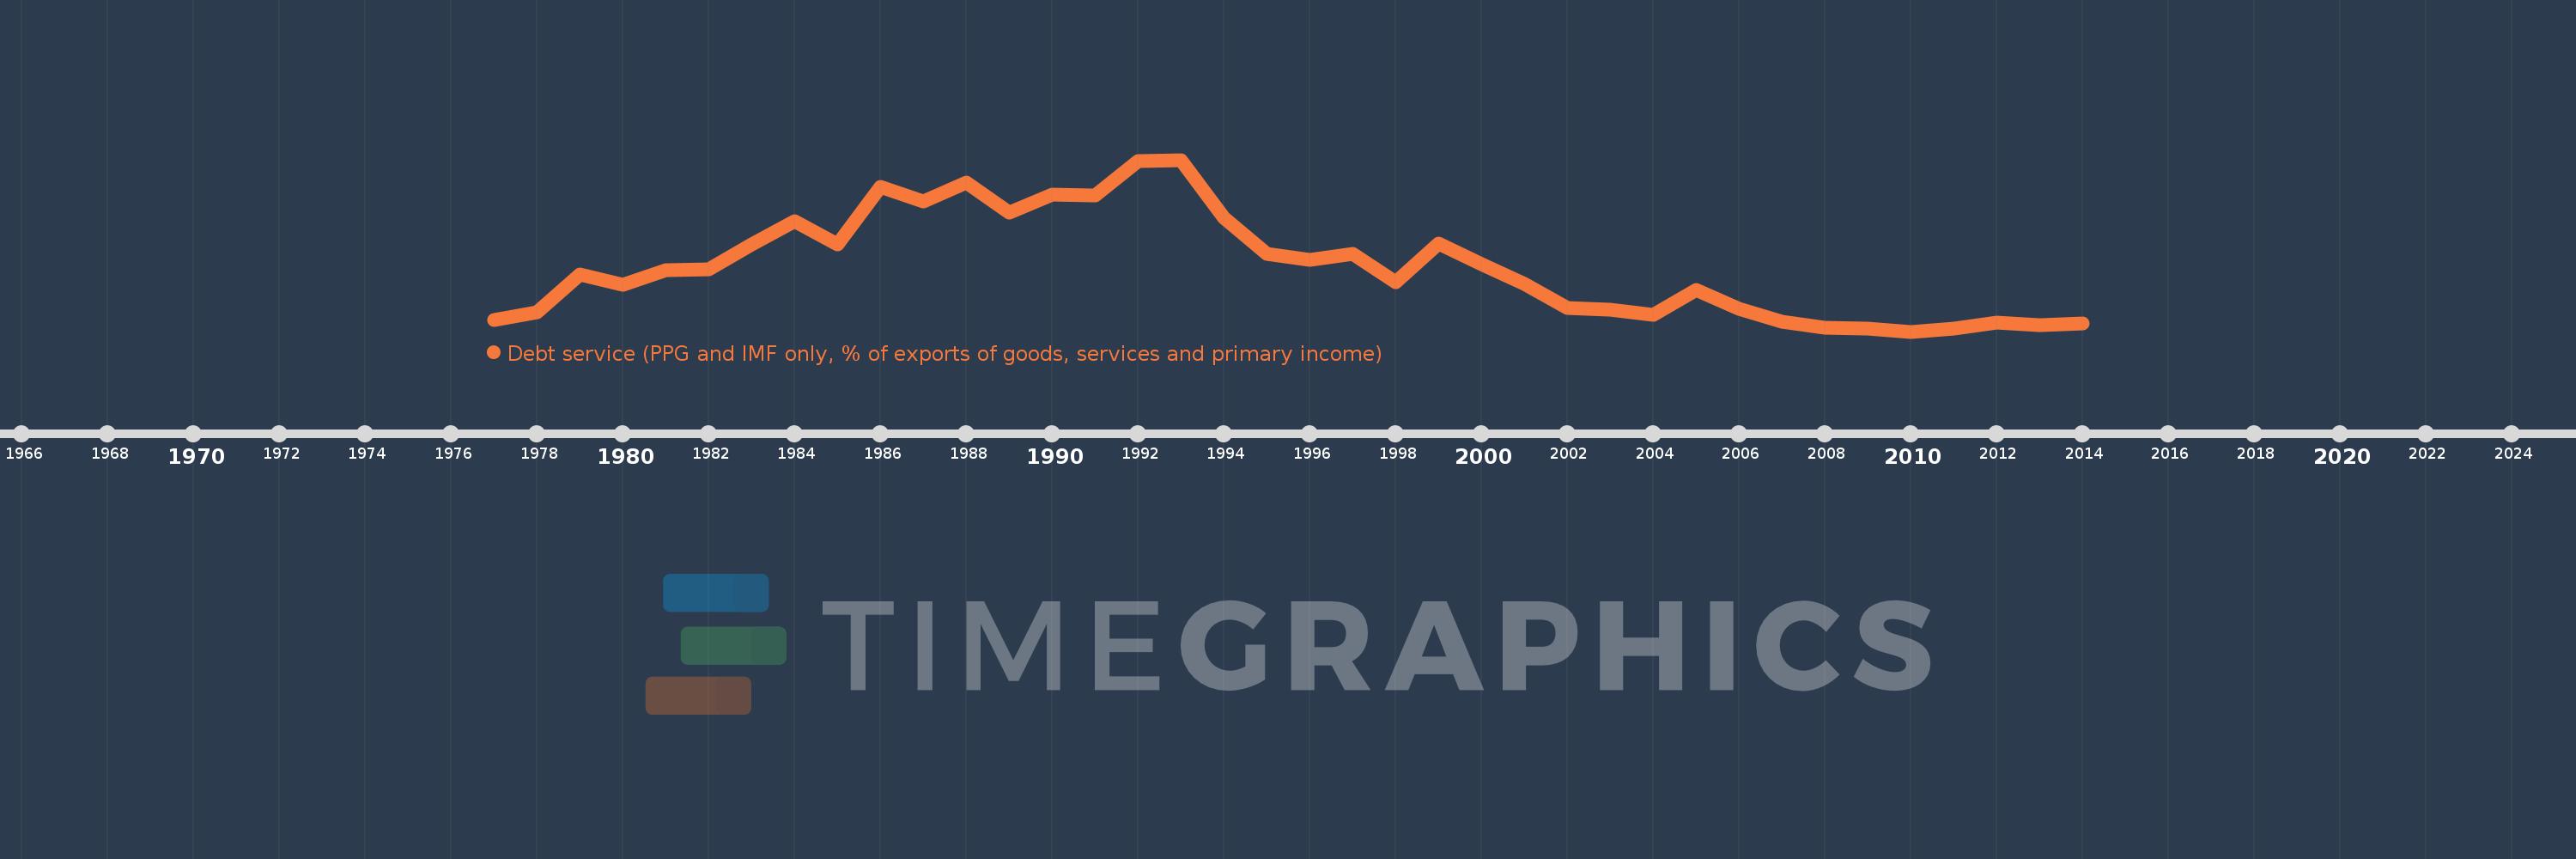
Debt service (PPG and IMF only, % of exports of goods, services and primary income)
2014,2013,2012,2011,2010,2009,2008,2007,2006,2005,2004,2003,2002,2001,2000,1999,1998,1997,1996,1995,1994,1993,1992,1991,1990,1989,1988,1987,1986,1985,1984,1983,1982,1981,1980,1979,1978,1977
Estas estatísticas em outros países:
Linha do tempo:
Nesta escala de tempo está apresentado um gráfico de 1977 ano até 2014 ano Tanzania. Dados de 1976 ano ausente. O número de observações reais por data: 38.
Fonte (nome):
Indicadores de desenvolvimento mundial
Fonte (organização):
World Bank, International Debt Statistics.
Categorias:
External Debt
Foi atualizado:
23 abr 2017 ano
Indicadores de alterações dos valores ao longo dos anos
Mínimo:
1.159
1 jan 2010 ano
Máximo:
39.271
1 jan 1993 ano
Na data de observação
Valor
Mudança absoluta
A alteração em relação ao valor anterior
1 jan 1977 ano
3.76
+3.76
0.0%
1 jan 1978 ano
5.393
+1.633
43.43%
1 jan 1979 ano
13.8
+8.408
155.9%
1 jan 1980 ano
11.531
-2.269
-16.45%
1 jan 1981 ano
14.81
+3.279
28.44%
1 jan 1982 ano
14.895
+0.084
0.57%
1 jan 1983 ano
20.415
+5.521
37.07%
1 jan 1984 ano
25.627
+5.211
25.53%
1 jan 1985 ano
20.443
-5.184
-20.23%
1 jan 1986 ano
33.266
+12.824
62.73%
1 jan 1987 ano
29.953
-3.313
-9.96%
1 jan 1988 ano
34.177
+4.224
14.1%
1 jan 1989 ano
27.585
-6.592
-19.29%
1 jan 1990 ano
31.646
+4.061
14.72%
1 jan 1991 ano
31.295
-0.351
-1.11%
1 jan 1992 ano
38.934
+7.639
24.41%
1 jan 1993 ano
39.271
+0.337
0.86%
1 jan 1994 ano
26.344
-12.927
-32.92%
1 jan 1995 ano
18.436
-7.908
-30.02%
1 jan 1996 ano
17.161
-1.275
-6.92%
1 jan 1997 ano
18.446
+1.285
7.49%
1 jan 1998 ano
12.176
-6.27
-33.99%
1 jan 1999 ano
20.729
+8.553
70.24%
1 jan 2000 ano
16.204
-4.525
-21.83%
1 jan 2001 ano
11.809
-4.395
-27.12%
1 jan 2002 ano
6.432
-5.377
-45.53%
1 jan 2003 ano
6.039
-0.393
-6.1%
1 jan 2004 ano
4.848
-1.191
-19.72%
1 jan 2005 ano
10.464
+5.616
115.83%
1 jan 2006 ano
6.27
-4.194
-40.08%
1 jan 2007 ano
3.435
-2.835
-45.21%
1 jan 2008 ano
2.061
-1.374
-40.0%
1 jan 2009 ano
1.912
-0.149
-7.24%
1 jan 2010 ano
1.159
-0.753
-39.39%
1 jan 2011 ano
1.83
+0.671
57.89%
1 jan 2012 ano
3.068
+1.239
67.7%
1 jan 2013 ano
2.554
-0.515
-16.78%
1 jan 2014 ano
2.971
+0.418
16.35%
Classificação de países por estatísticas atuais por anos


Comentários: