29
/it/
it
AIzaSyAYiBZKx7MnpbEhh9jyipgxe19OcubqV5w
April 1, 2024
260718
Tanzania
TZA
true
2
1
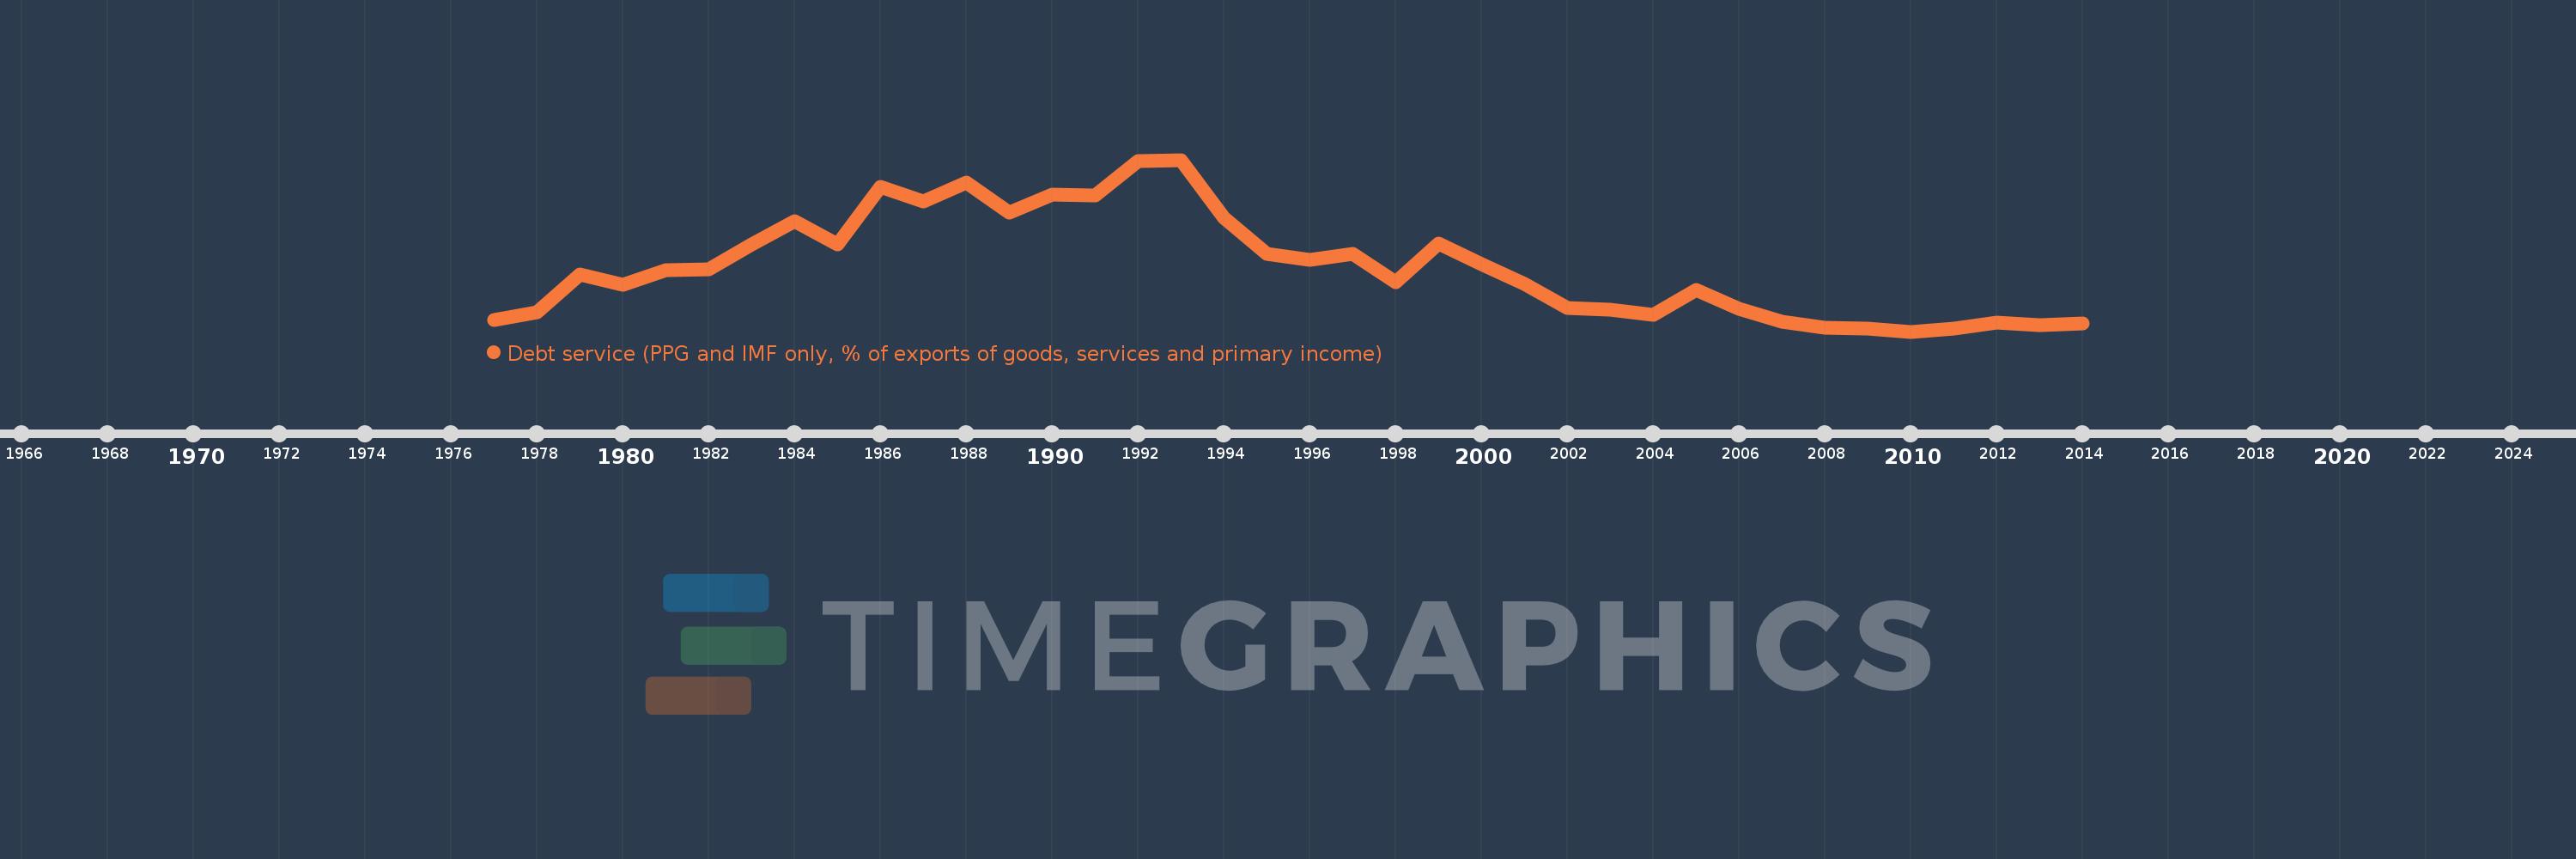
Debt service (PPG and IMF only, % of exports of goods, services and primary income)
2014,2013,2012,2011,2010,2009,2008,2007,2006,2005,2004,2003,2002,2001,2000,1999,1998,1997,1996,1995,1994,1993,1992,1991,1990,1989,1988,1987,1986,1985,1984,1983,1982,1981,1980,1979,1978,1977
Queste statistiche in altri paesi:
Linea del tempo:
Questa scala temporale mostra un grafico dal 1977 anno al 2014 anno. Tanzania. I dati fino ad 1976 anno non disponibili. Il numero di osservazioni attuali secondo i date: 38.
La fonte (nome):
Indicatori dello sviluppo mondiale
La fonte (organizzazione):
World Bank, International Debt Statistics.
Categorie:
External Debt
sono stati aggiornati
23 apr 2017 anni
Indicatori delle variazioni dei valori per anni
Minima:
1.159
1 gen 2010 anni
Massimo:
39.271
1 gen 1993 anni
Alla data di osservazione
Valore
Variazione assoluta
La variazione rispetto al valore precedente
1 gen 1977 anni
3.76
+3.76
0.0%
1 gen 1978 anni
5.393
+1.633
43.43%
1 gen 1979 anni
13.8
+8.408
155.9%
1 gen 1980 anni
11.531
-2.269
-16.45%
1 gen 1981 anni
14.81
+3.279
28.44%
1 gen 1982 anni
14.895
+0.084
0.57%
1 gen 1983 anni
20.415
+5.521
37.07%
1 gen 1984 anni
25.627
+5.211
25.53%
1 gen 1985 anni
20.443
-5.184
-20.23%
1 gen 1986 anni
33.266
+12.824
62.73%
1 gen 1987 anni
29.953
-3.313
-9.96%
1 gen 1988 anni
34.177
+4.224
14.1%
1 gen 1989 anni
27.585
-6.592
-19.29%
1 gen 1990 anni
31.646
+4.061
14.72%
1 gen 1991 anni
31.295
-0.351
-1.11%
1 gen 1992 anni
38.934
+7.639
24.41%
1 gen 1993 anni
39.271
+0.337
0.86%
1 gen 1994 anni
26.344
-12.927
-32.92%
1 gen 1995 anni
18.436
-7.908
-30.02%
1 gen 1996 anni
17.161
-1.275
-6.92%
1 gen 1997 anni
18.446
+1.285
7.49%
1 gen 1998 anni
12.176
-6.27
-33.99%
1 gen 1999 anni
20.729
+8.553
70.24%
1 gen 2000 anni
16.204
-4.525
-21.83%
1 gen 2001 anni
11.809
-4.395
-27.12%
1 gen 2002 anni
6.432
-5.377
-45.53%
1 gen 2003 anni
6.039
-0.393
-6.1%
1 gen 2004 anni
4.848
-1.191
-19.72%
1 gen 2005 anni
10.464
+5.616
115.83%
1 gen 2006 anni
6.27
-4.194
-40.08%
1 gen 2007 anni
3.435
-2.835
-45.21%
1 gen 2008 anni
2.061
-1.374
-40.0%
1 gen 2009 anni
1.912
-0.149
-7.24%
1 gen 2010 anni
1.159
-0.753
-39.39%
1 gen 2011 anni
1.83
+0.671
57.89%
1 gen 2012 anni
3.068
+1.239
67.7%
1 gen 2013 anni
2.554
-0.515
-16.78%
1 gen 2014 anni
2.971
+0.418
16.35%
Classificazione dei paesi secondo i statistiche attuali per anni


Commenti: