29
/it/
it
AIzaSyAYiBZKx7MnpbEhh9jyipgxe19OcubqV5w
April 1, 2024
144185
Guatemala
GTM
true
2
1
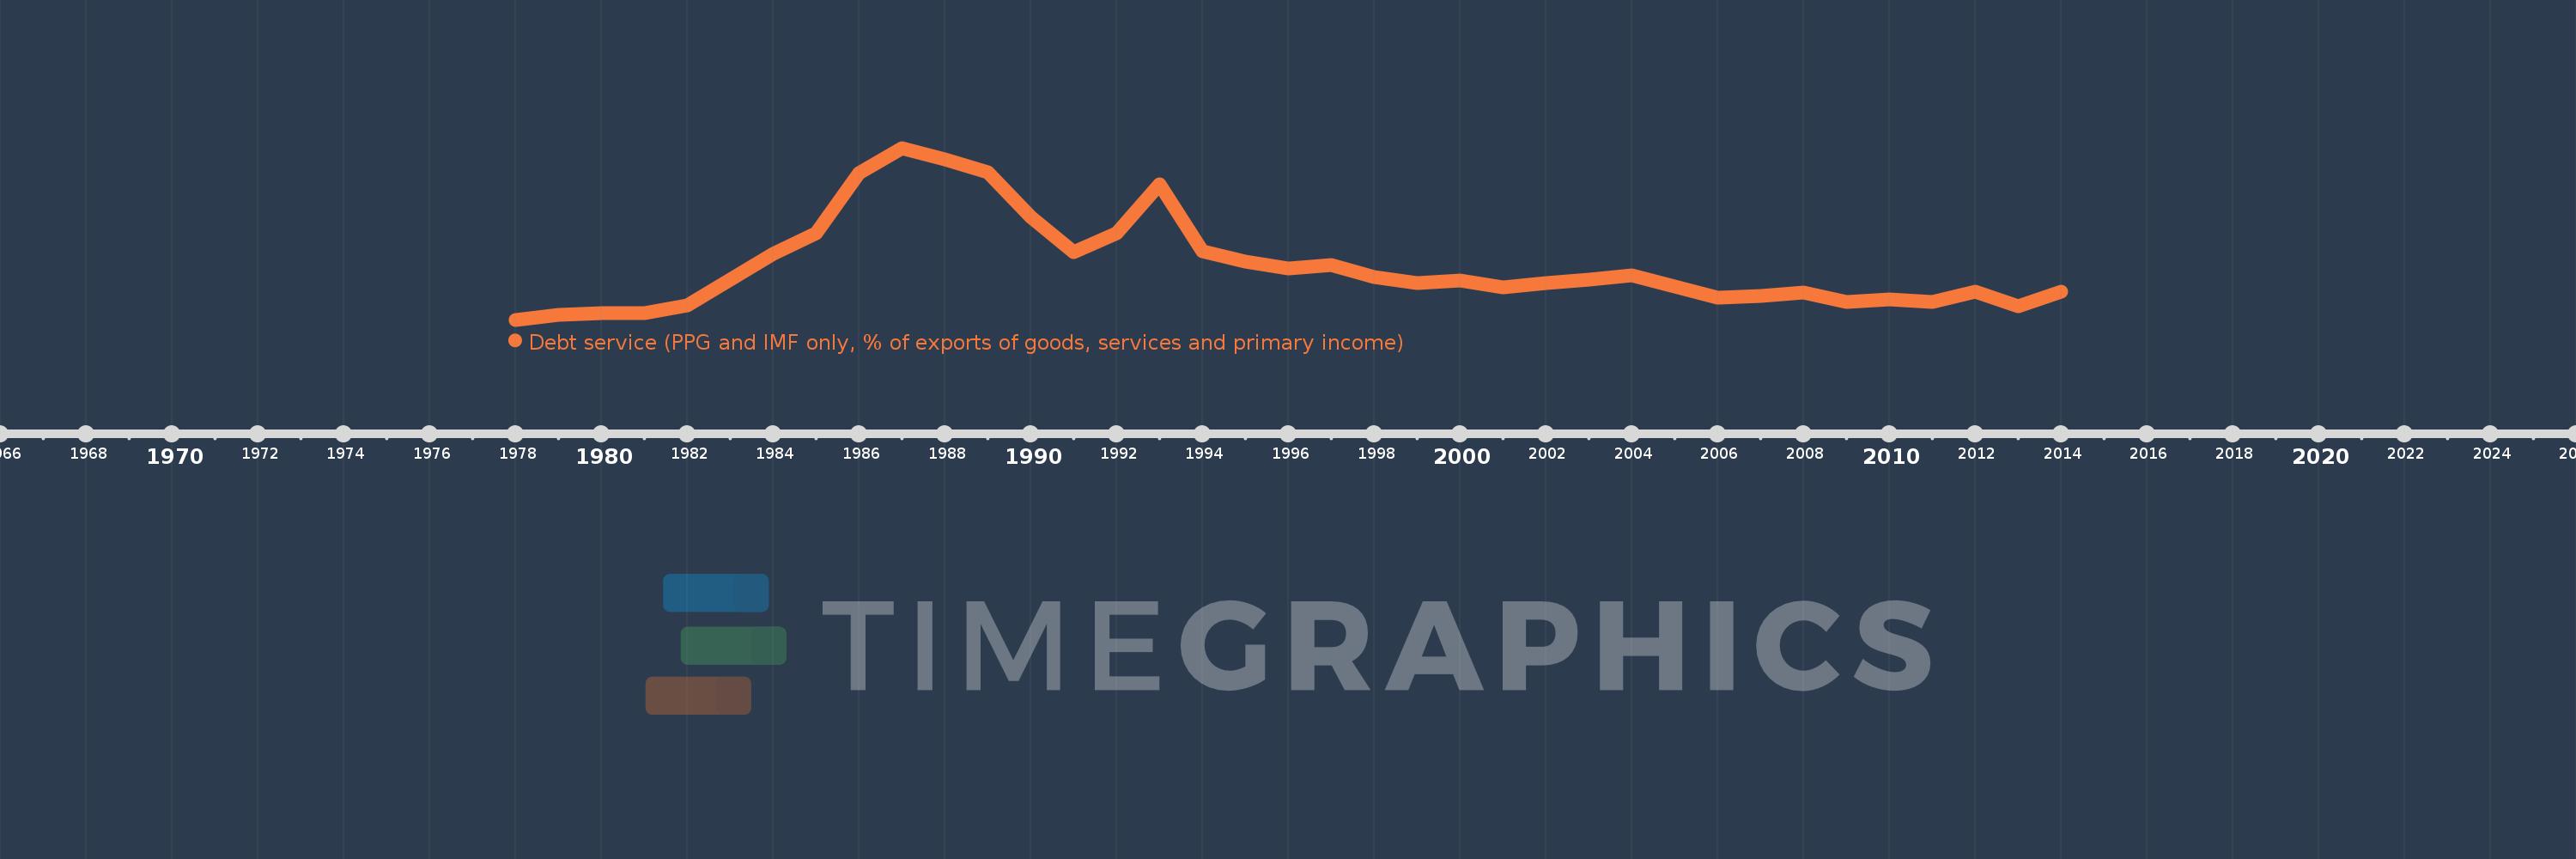
Debt service (PPG and IMF only, % of exports of goods, services and primary income)
2014,2013,2012,2011,2010,2009,2008,2007,2006,2005,2004,2003,2002,2001,2000,1999,1998,1997,1996,1995,1994,1993,1992,1991,1990,1989,1988,1987,1986,1985,1984,1983,1982,1981,1980,1979,1978
Queste statistiche in altri paesi:
Linea del tempo:
Questa scala temporale mostra un grafico dal 1978 anno al 2014 anno. Guatemala. I dati fino ad 1977 anno non disponibili. Il numero di osservazioni attuali secondo i date: 37.
La fonte (nome):
Indicatori dello sviluppo mondiale
La fonte (organizzazione):
World Bank, International Debt Statistics.
Categorie:
External Debt
sono stati aggiornati
23 apr 2017 anni
Indicatori delle variazioni dei valori per anni
Minima:
1.786
1 gen 1978 anni
Massimo:
31.913
1 gen 1987 anni
Alla data di osservazione
Valore
Variazione assoluta
La variazione rispetto al valore precedente
1 gen 1978 anni
1.786
+1.786
0.0%
1 gen 1979 anni
2.588
+0.803
44.95%
1 gen 1980 anni
2.872
+0.284
10.97%
1 gen 1981 anni
2.871
-0.001
-0.02%
1 gen 1982 anni
4.372
+1.501
52.26%
1 gen 1983 anni
8.89
+4.518
103.35%
1 gen 1984 anni
13.369
+4.479
50.38%
1 gen 1985 anni
17.03
+3.661
27.38%
1 gen 1986 anni
27.504
+10.474
61.5%
1 gen 1987 anni
31.913
+4.409
16.03%
1 gen 1988 anni
29.953
-1.96
-6.14%
1 gen 1989 anni
27.684
-2.268
-7.57%
1 gen 1990 anni
19.891
-7.794
-28.15%
1 gen 1991 anni
13.59
-6.301
-31.68%
1 gen 1992 anni
17.025
+3.435
25.27%
1 gen 1993 anni
25.589
+8.564
50.3%
1 gen 1994 anni
13.812
-11.777
-46.02%
1 gen 1995 anni
11.909
-1.903
-13.77%
1 gen 1996 anni
10.77
-1.14
-9.57%
1 gen 1997 anni
11.324
+0.555
5.15%
1 gen 1998 anni
9.257
-2.067
-18.25%
1 gen 1999 anni
8.208
-1.049
-11.33%
1 gen 2000 anni
8.603
+0.395
4.81%
1 gen 2001 anni
7.54
-1.063
-12.36%
1 gen 2002 anni
8.246
+0.707
9.37%
1 gen 2003 anni
8.88
+0.634
7.69%
1 gen 2004 anni
9.567
+0.687
7.74%
1 gen 2005 anni
7.623
-1.944
-20.32%
1 gen 2006 anni
5.718
-1.905
-24.99%
1 gen 2007 anni
5.897
+0.179
3.14%
1 gen 2008 anni
6.589
+0.692
11.73%
1 gen 2009 anni
4.904
-1.684
-25.56%
1 gen 2010 anni
5.391
+0.486
9.92%
1 gen 2011 anni
4.913
-0.477
-8.85%
1 gen 2012 anni
6.741
+1.827
37.19%
1 gen 2013 anni
4.217
-2.524
-37.45%
1 gen 2014 anni
6.74
+2.524
59.85%
Classificazione dei paesi secondo i statistiche attuali per anni


Commenti: