29
/it/
it
AIzaSyAYiBZKx7MnpbEhh9jyipgxe19OcubqV5w
April 1, 2024
235582
Senegal
SEN
true
2
1
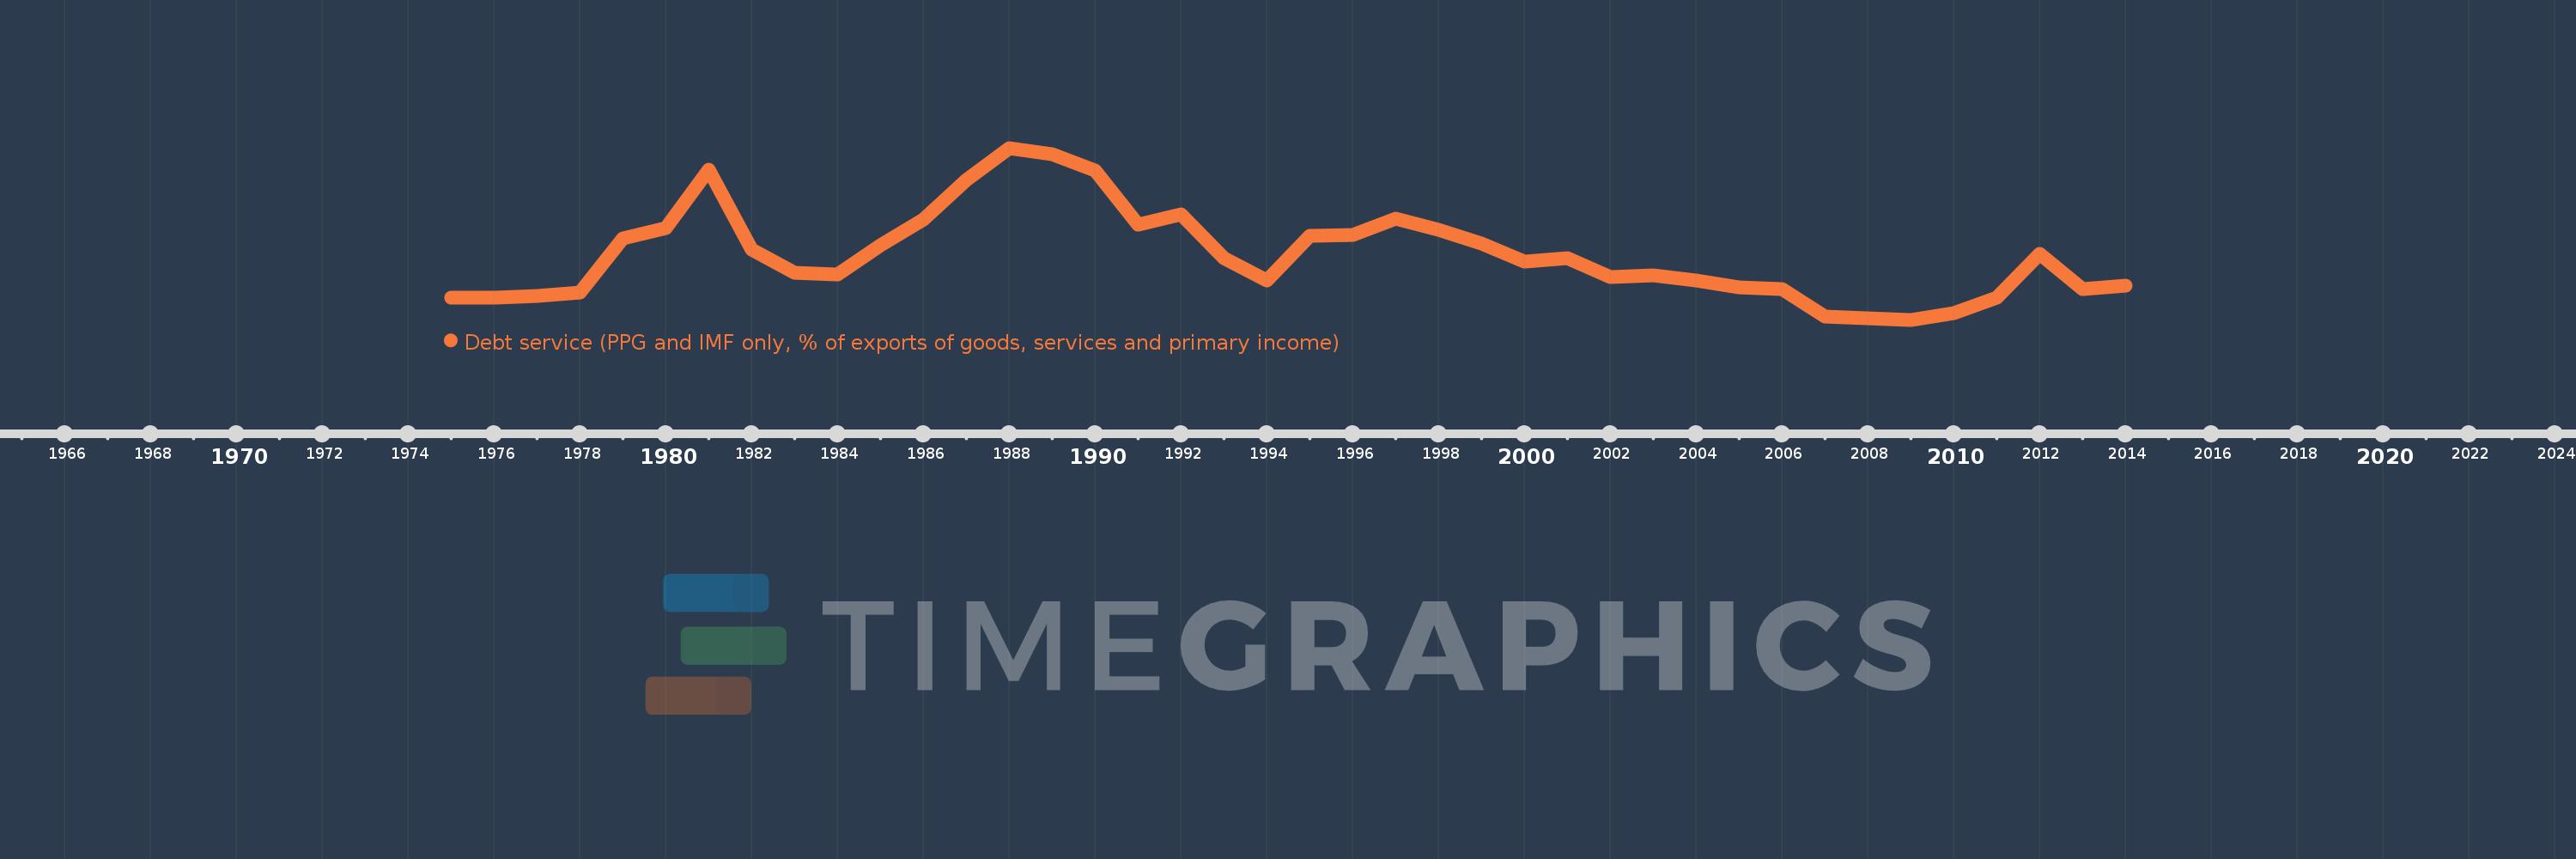
Debt service (PPG and IMF only, % of exports of goods, services and primary income)
2014,2013,2012,2011,2010,2009,2008,2007,2006,2005,2004,2003,2002,2001,2000,1999,1998,1997,1996,1995,1994,1993,1992,1991,1990,1989,1988,1987,1986,1985,1984,1983,1982,1981,1980,1979,1978,1977,1976,1975
Queste statistiche in altri paesi:
Linea del tempo:
Questa scala temporale mostra un grafico dal 1975 anno al 2014 anno. Senegal. I dati fino ad 1974 anno non disponibili. Il numero di osservazioni attuali secondo i date: 40.
La fonte (nome):
Indicatori dello sviluppo mondiale
La fonte (organizzazione):
World Bank, International Debt Statistics.
Categorie:
External Debt
sono stati aggiornati
23 apr 2017 anni
Indicatori delle variazioni dei valori per anni
Minima:
1.951
1 gen 2009 anni
Massimo:
31.512
1 gen 1988 anni
Alla data di osservazione
Valore
Variazione assoluta
La variazione rispetto al valore precedente
1 gen 1975 anni
5.696
+5.696
0.0%
1 gen 1976 anni
5.678
-0.018
-0.31%
1 gen 1977 anni
6.084
+0.406
7.15%
1 gen 1978 anni
6.592
+0.508
8.35%
1 gen 1979 anni
16.014
+9.422
142.93%
1 gen 1980 anni
17.672
+1.658
10.35%
1 gen 1981 anni
27.731
+10.059
56.92%
1 gen 1982 anni
14.042
-13.689
-49.36%
1 gen 1983 anni
10.106
-3.935
-28.03%
1 gen 1984 anni
9.759
-0.347
-3.43%
1 gen 1985 anni
14.792
+5.033
51.58%
1 gen 1986 anni
19.194
+4.401
29.75%
1 gen 1987 anni
25.942
+6.749
35.16%
1 gen 1988 anni
31.512
+5.57
21.47%
1 gen 1989 anni
30.486
-1.026
-3.26%
1 gen 1990 anni
27.615
-2.871
-9.42%
1 gen 1991 anni
18.281
-9.334
-33.8%
1 gen 1992 anni
20.053
+1.772
9.7%
1 gen 1993 anni
12.542
-7.511
-37.45%
1 gen 1994 anni
8.695
-3.847
-30.68%
1 gen 1995 anni
16.328
+7.633
87.79%
1 gen 1996 anni
16.466
+0.137
0.84%
1 gen 1997 anni
19.337
+2.871
17.44%
1 gen 1998 anni
17.441
-1.896
-9.8%
1 gen 1999 anni
15.0
-2.441
-14.0%
1 gen 2000 anni
12.0
-3.0
-20.0%
1 gen 2001 anni
12.529
+0.529
4.41%
1 gen 2002 anni
9.295
-3.234
-25.81%
1 gen 2003 anni
9.528
+0.233
2.51%
1 gen 2004 anni
8.724
-0.804
-8.44%
1 gen 2005 anni
7.514
-1.21
-13.87%
1 gen 2006 anni
7.164
-0.35
-4.65%
1 gen 2007 anni
2.53
-4.634
-64.68%
1 gen 2008 anni
2.149
-0.382
-15.08%
1 gen 2009 anni
1.951
-0.198
-9.19%
1 gen 2010 anni
3.077
+1.125
57.67%
1 gen 2011 anni
5.746
+2.67
86.78%
1 gen 2012 anni
13.225
+7.478
130.13%
1 gen 2013 anni
7.244
-5.981
-45.22%
1 gen 2014 anni
7.749
+0.505
6.97%
Classificazione dei paesi secondo i statistiche attuali per anni


Commenti: