29
/it/
it
AIzaSyAYiBZKx7MnpbEhh9jyipgxe19OcubqV5w
April 1, 2024
218152
Panama
PAN
true
2
1
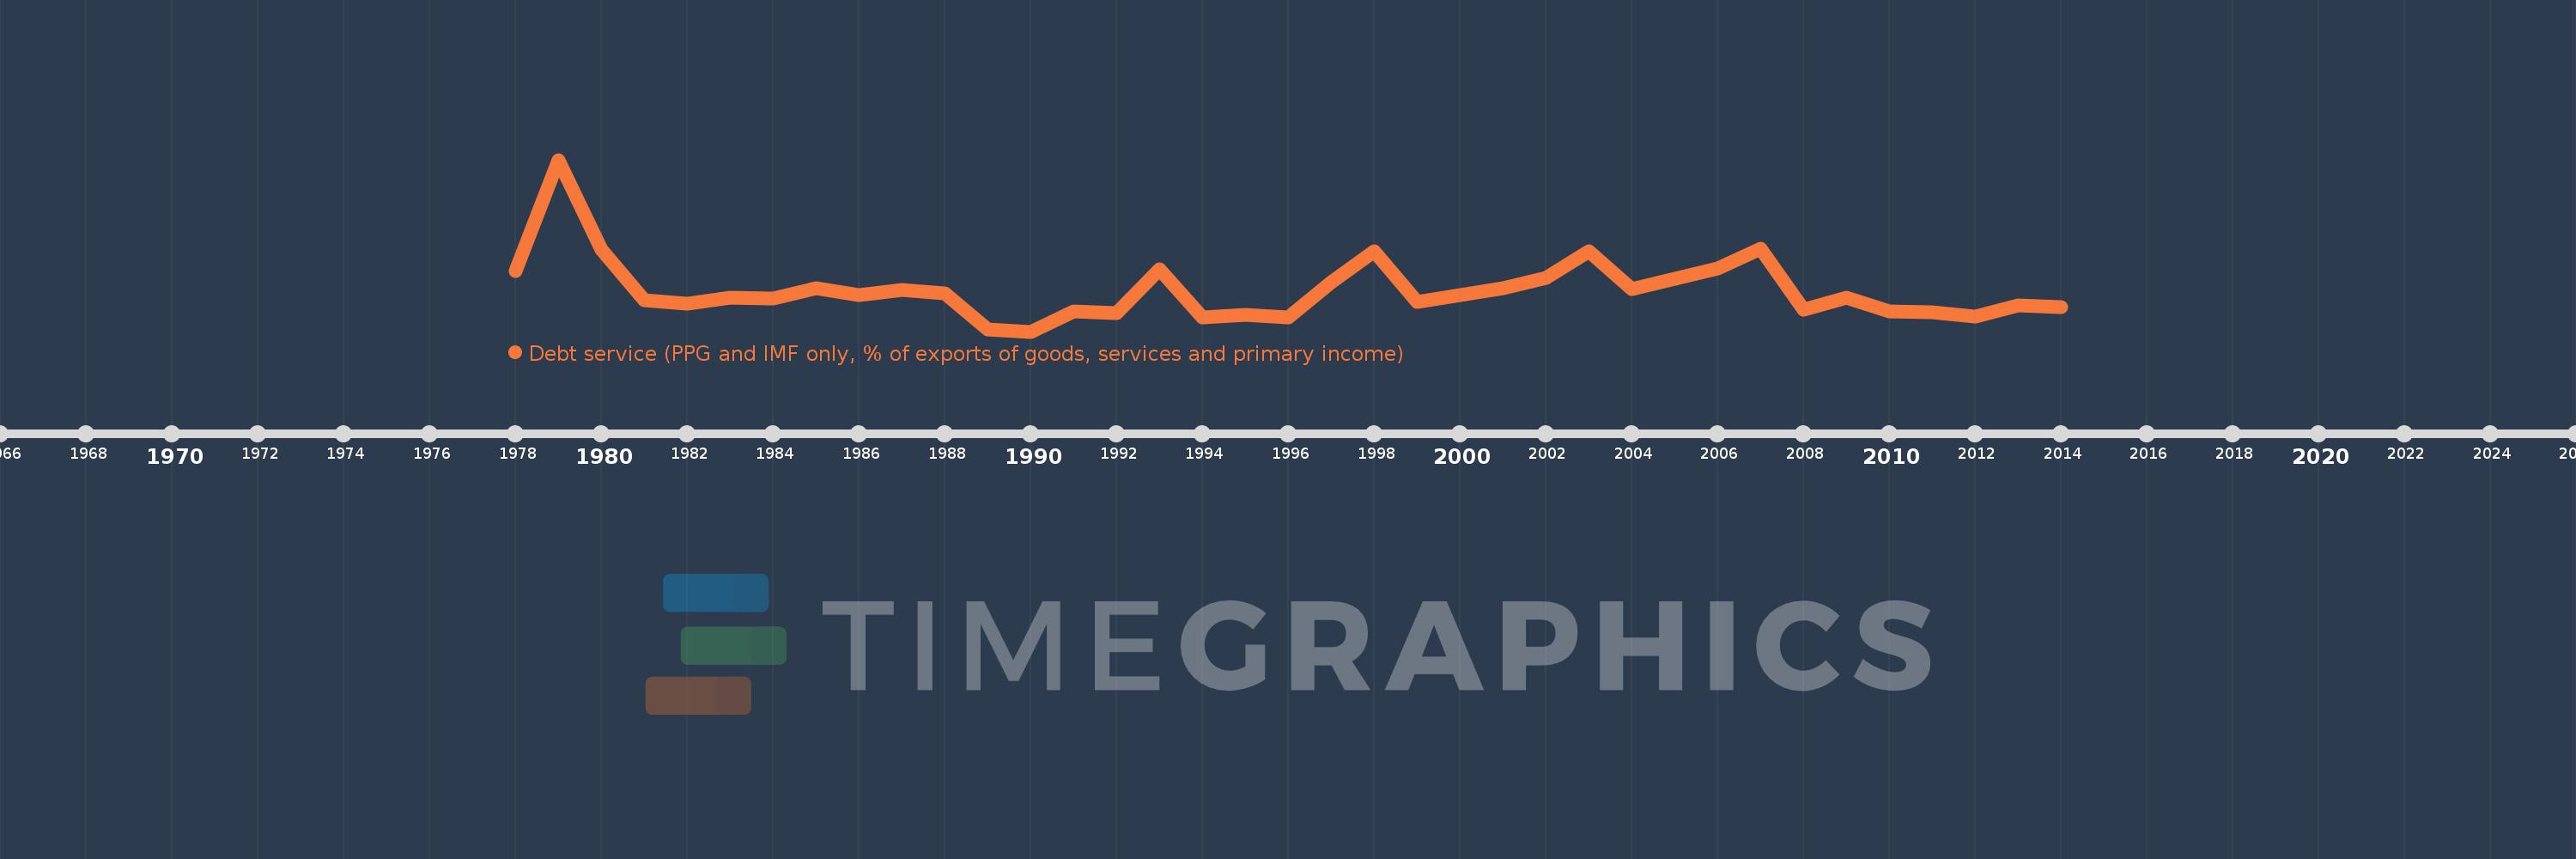
Debt service (PPG and IMF only, % of exports of goods, services and primary income)
2014,2013,2012,2011,2010,2009,2008,2007,2006,2005,2004,2003,2002,2001,2000,1999,1998,1997,1996,1995,1994,1993,1992,1991,1990,1989,1988,1987,1986,1985,1984,1983,1982,1981,1980,1979,1978
Queste statistiche in altri paesi:
Linea del tempo:
Questa scala temporale mostra un grafico dal 1978 anno al 2014 anno. Panama. I dati fino ad 1977 anno non disponibili. Il numero di osservazioni attuali secondo i date: 37.
La fonte (nome):
Indicatori dello sviluppo mondiale
La fonte (organizzazione):
World Bank, International Debt Statistics.
Categorie:
External Debt
sono stati aggiornati
23 apr 2017 anni
Indicatori delle variazioni dei valori per anni
Minima:
0.284
1 gen 1990 anni
Massimo:
33.003
1 gen 1979 anni
Alla data di osservazione
Valore
Variazione assoluta
La variazione rispetto al valore precedente
1 gen 1978 anni
11.877
+11.877
0.0%
1 gen 1979 anni
33.003
+21.127
177.89%
1 gen 1980 anni
15.835
-17.168
-52.02%
1 gen 1981 anni
6.192
-9.644
-60.9%
1 gen 1982 anni
5.619
-0.572
-9.24%
1 gen 1983 anni
6.665
+1.045
18.6%
1 gen 1984 anni
6.641
-0.023
-0.35%
1 gen 1985 anni
8.464
+1.823
27.45%
1 gen 1986 anni
7.174
-1.29
-15.24%
1 gen 1987 anni
8.263
+1.089
15.18%
1 gen 1988 anni
7.5
-0.763
-9.23%
1 gen 1989 anni
0.62
-6.88
-91.73%
1 gen 1990 anni
0.284
-0.336
-54.13%
1 gen 1991 anni
4.092
+3.807
1.34 Mille.%
1 gen 1992 anni
3.862
-0.23
-5.62%
1 gen 1993 anni
12.206
+8.345
216.09%
1 gen 1994 anni
2.989
-9.217
-75.51%
1 gen 1995 anni
3.55
+0.561
18.76%
1 gen 1996 anni
3.028
-0.522
-14.72%
1 gen 1997 anni
9.649
+6.621
218.69%
1 gen 1998 anni
15.528
+5.879
60.94%
1 gen 1999 anni
5.91
-9.618
-61.94%
1 gen 2000 anni
7.272
+1.362
23.05%
1 gen 2001 anni
8.618
+1.346
18.52%
1 gen 2002 anni
10.436
+1.818
21.1%
1 gen 2003 anni
15.512
+5.076
48.64%
1 gen 2004 anni
8.322
-7.19
-46.35%
1 gen 2005 anni
10.344
+2.022
24.3%
1 gen 2006 anni
12.232
+1.888
18.25%
1 gen 2007 anni
16.114
+3.882
31.74%
1 gen 2008 anni
4.51
-11.604
-72.01%
1 gen 2009 anni
6.782
+2.272
50.38%
1 gen 2010 anni
4.134
-2.648
-39.04%
1 gen 2011 anni
3.94
-0.194
-4.68%
1 gen 2012 anni
3.149
-0.791
-20.08%
1 gen 2013 anni
5.348
+2.198
69.81%
1 gen 2014 anni
4.869
-0.478
-8.94%
Classificazione dei paesi secondo i statistiche attuali per anni


Commenti: