29
/fr/
fr
AIzaSyAYiBZKx7MnpbEhh9jyipgxe19OcubqV5w
April 1, 2024
218152
Panama
PAN
true
2
1
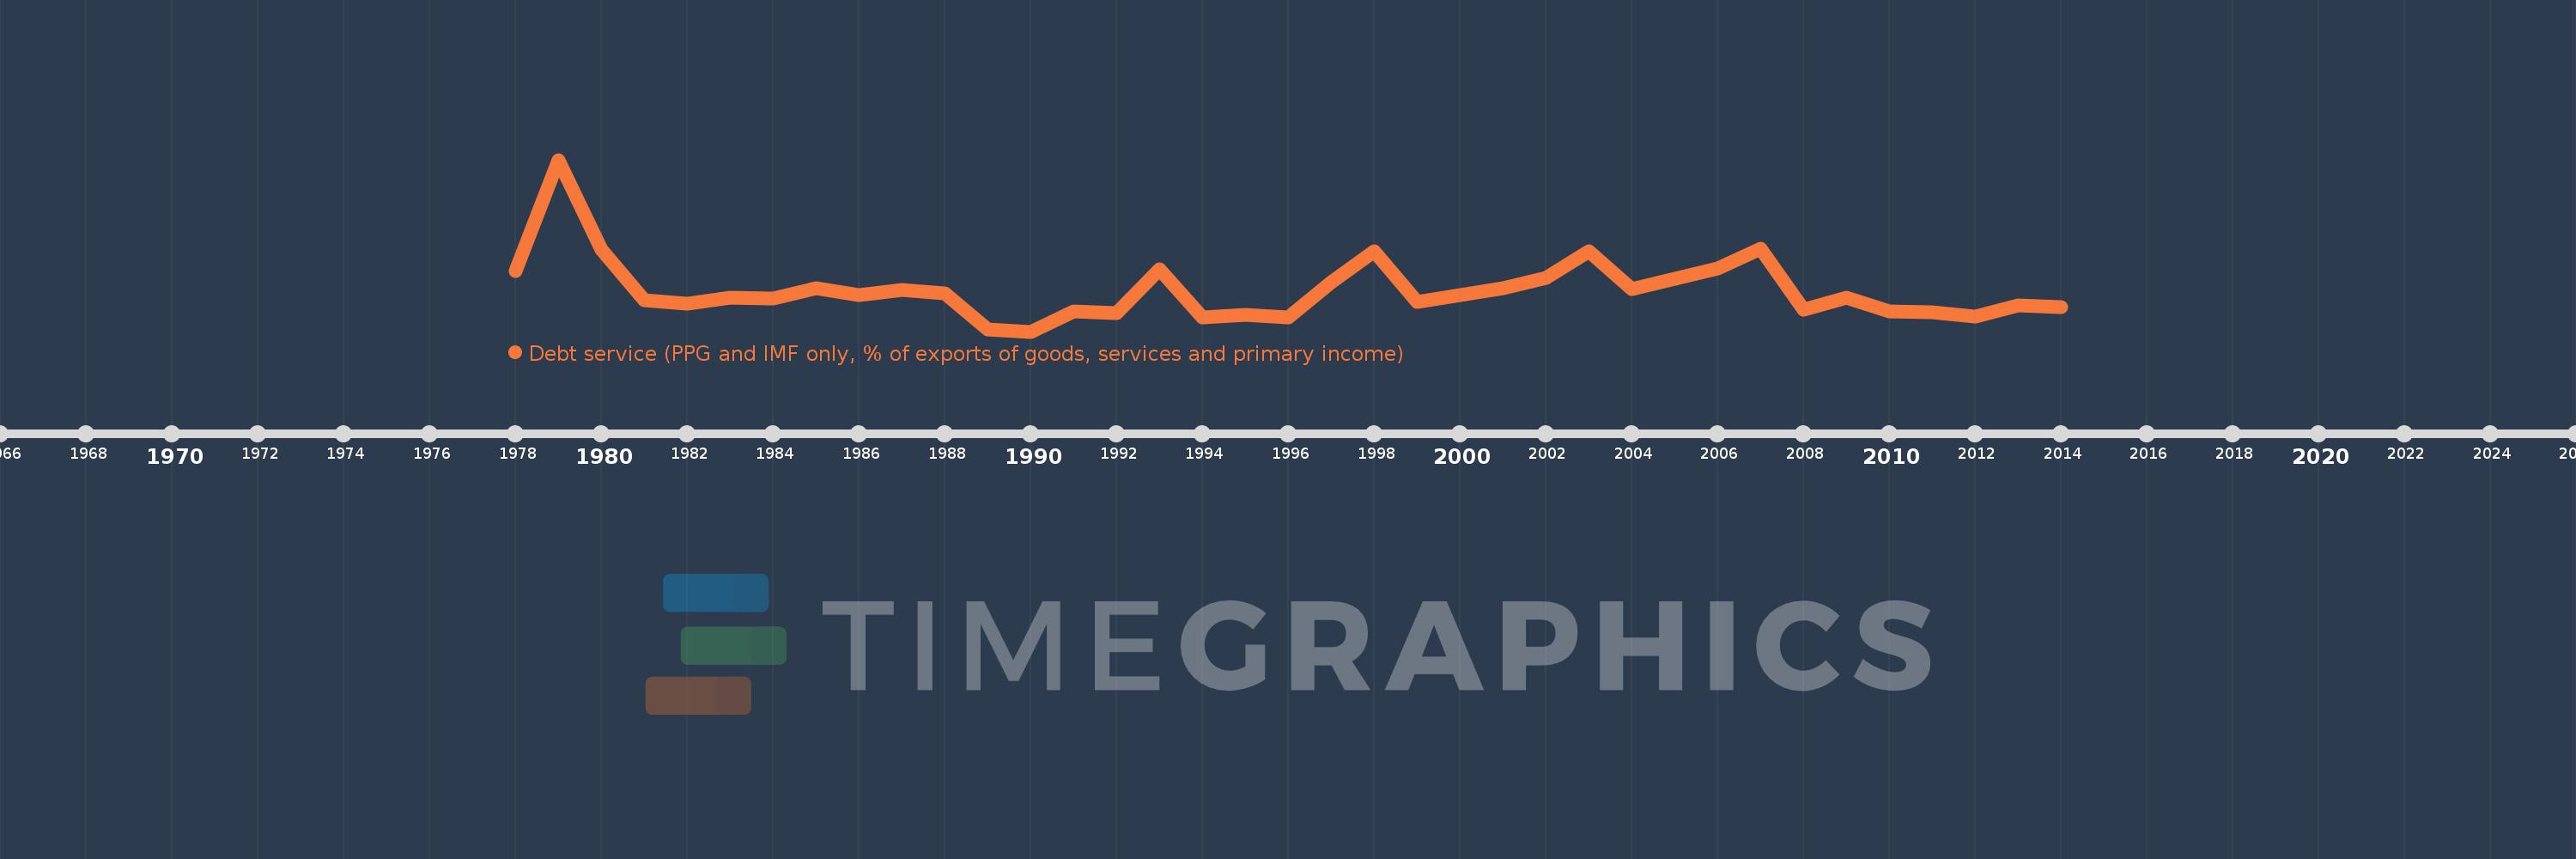
Debt service (PPG and IMF only, % of exports of goods, services and primary income)
2014,2013,2012,2011,2010,2009,2008,2007,2006,2005,2004,2003,2002,2001,2000,1999,1998,1997,1996,1995,1994,1993,1992,1991,1990,1989,1988,1987,1986,1985,1984,1983,1982,1981,1980,1979,1978
Cette statistique dans les autres pays:
La ligne de temps
Cette échelle de temps montre un graphique de 1978 année à 2014 année Panama. Les données jusqu'à 1977 année ne sont pas présentés. Quantité d'observations actuelles selon dates: 37.
Source (désignation):
Les indicateurs du développement mondiale
Source (organisation):
World Bank, International Debt Statistics.
Catégories:
External Debt
Dernière mise à jour
23 avr. 2017
Les indicateurs de changement de valeurs selon les années
Minimum:
0.284
1 janv. 1990
Maximum:
33.003
1 janv. 1979
Pour la date d''observation
Valeur
Changement absolu
Le changement par rapport à la valeur précédente
1 janv. 1978
11.877
+11.877
0.0%
1 janv. 1979
33.003
+21.127
177.89%
1 janv. 1980
15.835
-17.168
-52.02%
1 janv. 1981
6.192
-9.644
-60.9%
1 janv. 1982
5.619
-0.572
-9.24%
1 janv. 1983
6.665
+1.045
18.6%
1 janv. 1984
6.641
-0.023
-0.35%
1 janv. 1985
8.464
+1.823
27.45%
1 janv. 1986
7.174
-1.29
-15.24%
1 janv. 1987
8.263
+1.089
15.18%
1 janv. 1988
7.5
-0.763
-9.23%
1 janv. 1989
0.62
-6.88
-91.73%
1 janv. 1990
0.284
-0.336
-54.13%
1 janv. 1991
4.092
+3.807
1.34 milles%
1 janv. 1992
3.862
-0.23
-5.62%
1 janv. 1993
12.206
+8.345
216.09%
1 janv. 1994
2.989
-9.217
-75.51%
1 janv. 1995
3.55
+0.561
18.76%
1 janv. 1996
3.028
-0.522
-14.72%
1 janv. 1997
9.649
+6.621
218.69%
1 janv. 1998
15.528
+5.879
60.94%
1 janv. 1999
5.91
-9.618
-61.94%
1 janv. 2000
7.272
+1.362
23.05%
1 janv. 2001
8.618
+1.346
18.52%
1 janv. 2002
10.436
+1.818
21.1%
1 janv. 2003
15.512
+5.076
48.64%
1 janv. 2004
8.322
-7.19
-46.35%
1 janv. 2005
10.344
+2.022
24.3%
1 janv. 2006
12.232
+1.888
18.25%
1 janv. 2007
16.114
+3.882
31.74%
1 janv. 2008
4.51
-11.604
-72.01%
1 janv. 2009
6.782
+2.272
50.38%
1 janv. 2010
4.134
-2.648
-39.04%
1 janv. 2011
3.94
-0.194
-4.68%
1 janv. 2012
3.149
-0.791
-20.08%
1 janv. 2013
5.348
+2.198
69.81%
1 janv. 2014
4.869
-0.478
-8.94%
Classement des pays selon les statistiques actuelles par années


Commentaires: