29
/fr/
fr
AIzaSyAYiBZKx7MnpbEhh9jyipgxe19OcubqV5w
April 1, 2024
155803
Indonesia
IDN
true
2
1
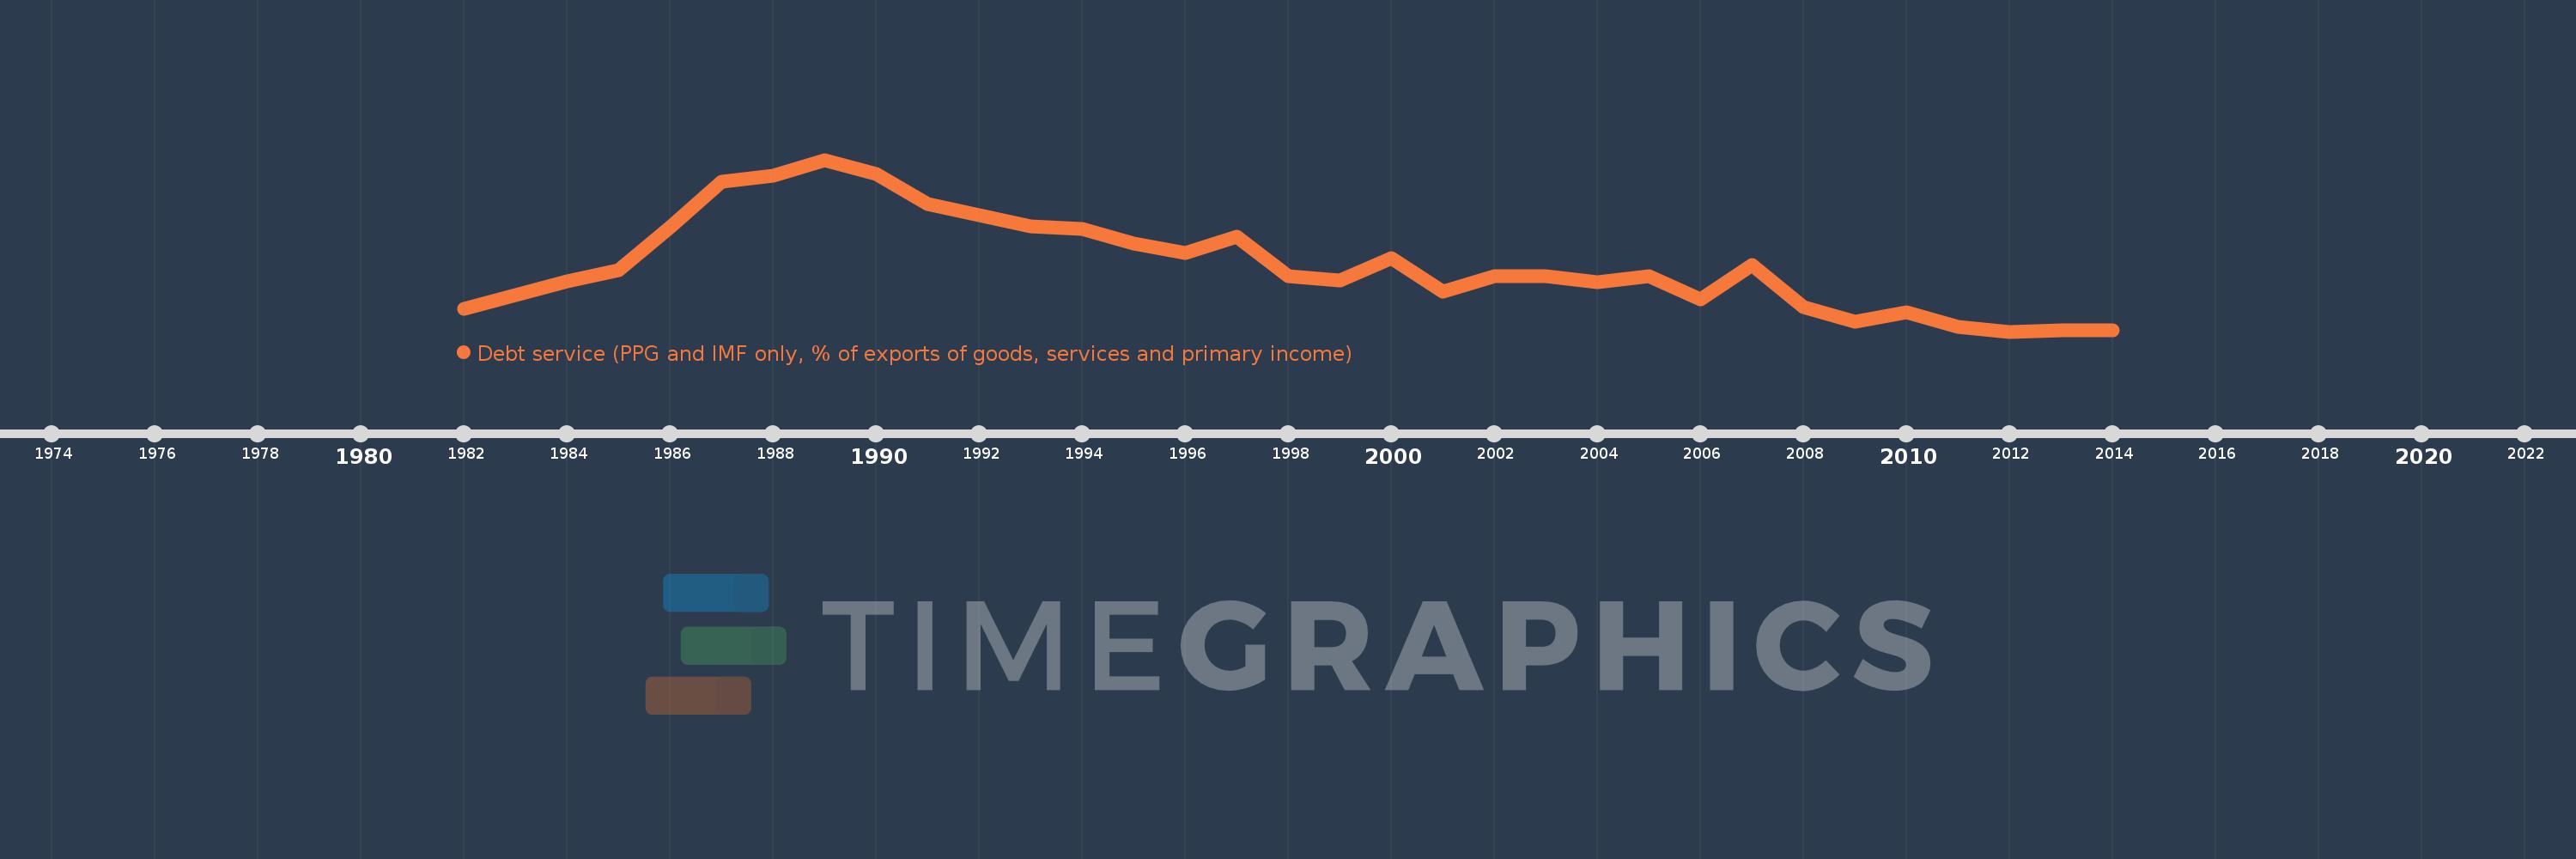
Debt service (PPG and IMF only, % of exports of goods, services and primary income)
2014,2013,2012,2011,2010,2009,2008,2007,2006,2005,2004,2003,2002,2001,2000,1999,1998,1997,1996,1995,1994,1993,1992,1991,1990,1989,1988,1987,1986,1985,1984,1983,1982
Cette statistique dans les autres pays:
La ligne de temps
Cette échelle de temps montre un graphique de 1982 année à 2014 année Indonesia. Les données jusqu'à 1981 année ne sont pas présentés. Quantité d'observations actuelles selon dates: 33.
Source (désignation):
Les indicateurs du développement mondiale
Source (organisation):
World Bank, International Debt Statistics.
Catégories:
External Debt
Dernière mise à jour
23 avr. 2017
Les indicateurs de changement de valeurs selon les années
Minimum:
4.462
1 janv. 2012
Maximum:
32.969
1 janv. 1989
Pour la date d''observation
Valeur
Changement absolu
Le changement par rapport à la valeur précédente
1 janv. 1982
8.196
+8.196
0.0%
1 janv. 1983
10.511
+2.315
28.24%
1 janv. 1984
12.756
+2.245
21.35%
1 janv. 1985
14.723
+1.968
15.42%
1 janv. 1986
21.81
+7.087
48.14%
1 janv. 1987
29.4
+7.59
34.8%
1 janv. 1988
30.263
+0.863
2.94%
1 janv. 1989
32.969
+2.706
8.94%
1 janv. 1990
30.565
-2.403
-7.29%
1 janv. 1991
25.622
-4.943
-16.17%
1 janv. 1992
23.762
-1.86
-7.26%
1 janv. 1993
21.953
-1.809
-7.61%
1 janv. 1994
21.448
-0.505
-2.3%
1 janv. 1995
19.085
-2.364
-11.02%
1 janv. 1996
17.5
-1.584
-8.3%
1 janv. 1997
20.258
+2.758
15.76%
1 janv. 1998
13.701
-6.557
-32.37%
1 janv. 1999
12.889
-0.812
-5.93%
1 janv. 2000
16.677
+3.788
29.39%
1 janv. 2001
11.146
-5.531
-33.16%
1 janv. 2002
13.69
+2.544
22.82%
1 janv. 2003
13.637
-0.053
-0.39%
1 janv. 2004
12.725
-0.912
-6.69%
1 janv. 2005
13.638
+0.913
7.17%
1 janv. 2006
9.861
-3.777
-27.69%
1 janv. 2007
15.466
+5.605
56.84%
1 janv. 2008
8.486
-6.98
-45.13%
1 janv. 2009
6.087
-2.399
-28.27%
1 janv. 2010
7.687
+1.6
26.28%
1 janv. 2011
5.273
-2.413
-31.4%
1 janv. 2012
4.462
-0.811
-15.38%
1 janv. 2013
4.627
+0.165
3.69%
1 janv. 2014
4.716
+0.089
1.93%
Classement des pays selon les statistiques actuelles par années


Commentaires: