29
/fr/
fr
AIzaSyAYiBZKx7MnpbEhh9jyipgxe19OcubqV5w
April 1, 2024
284497
Yemen, Rep.
YEM
true
2
1
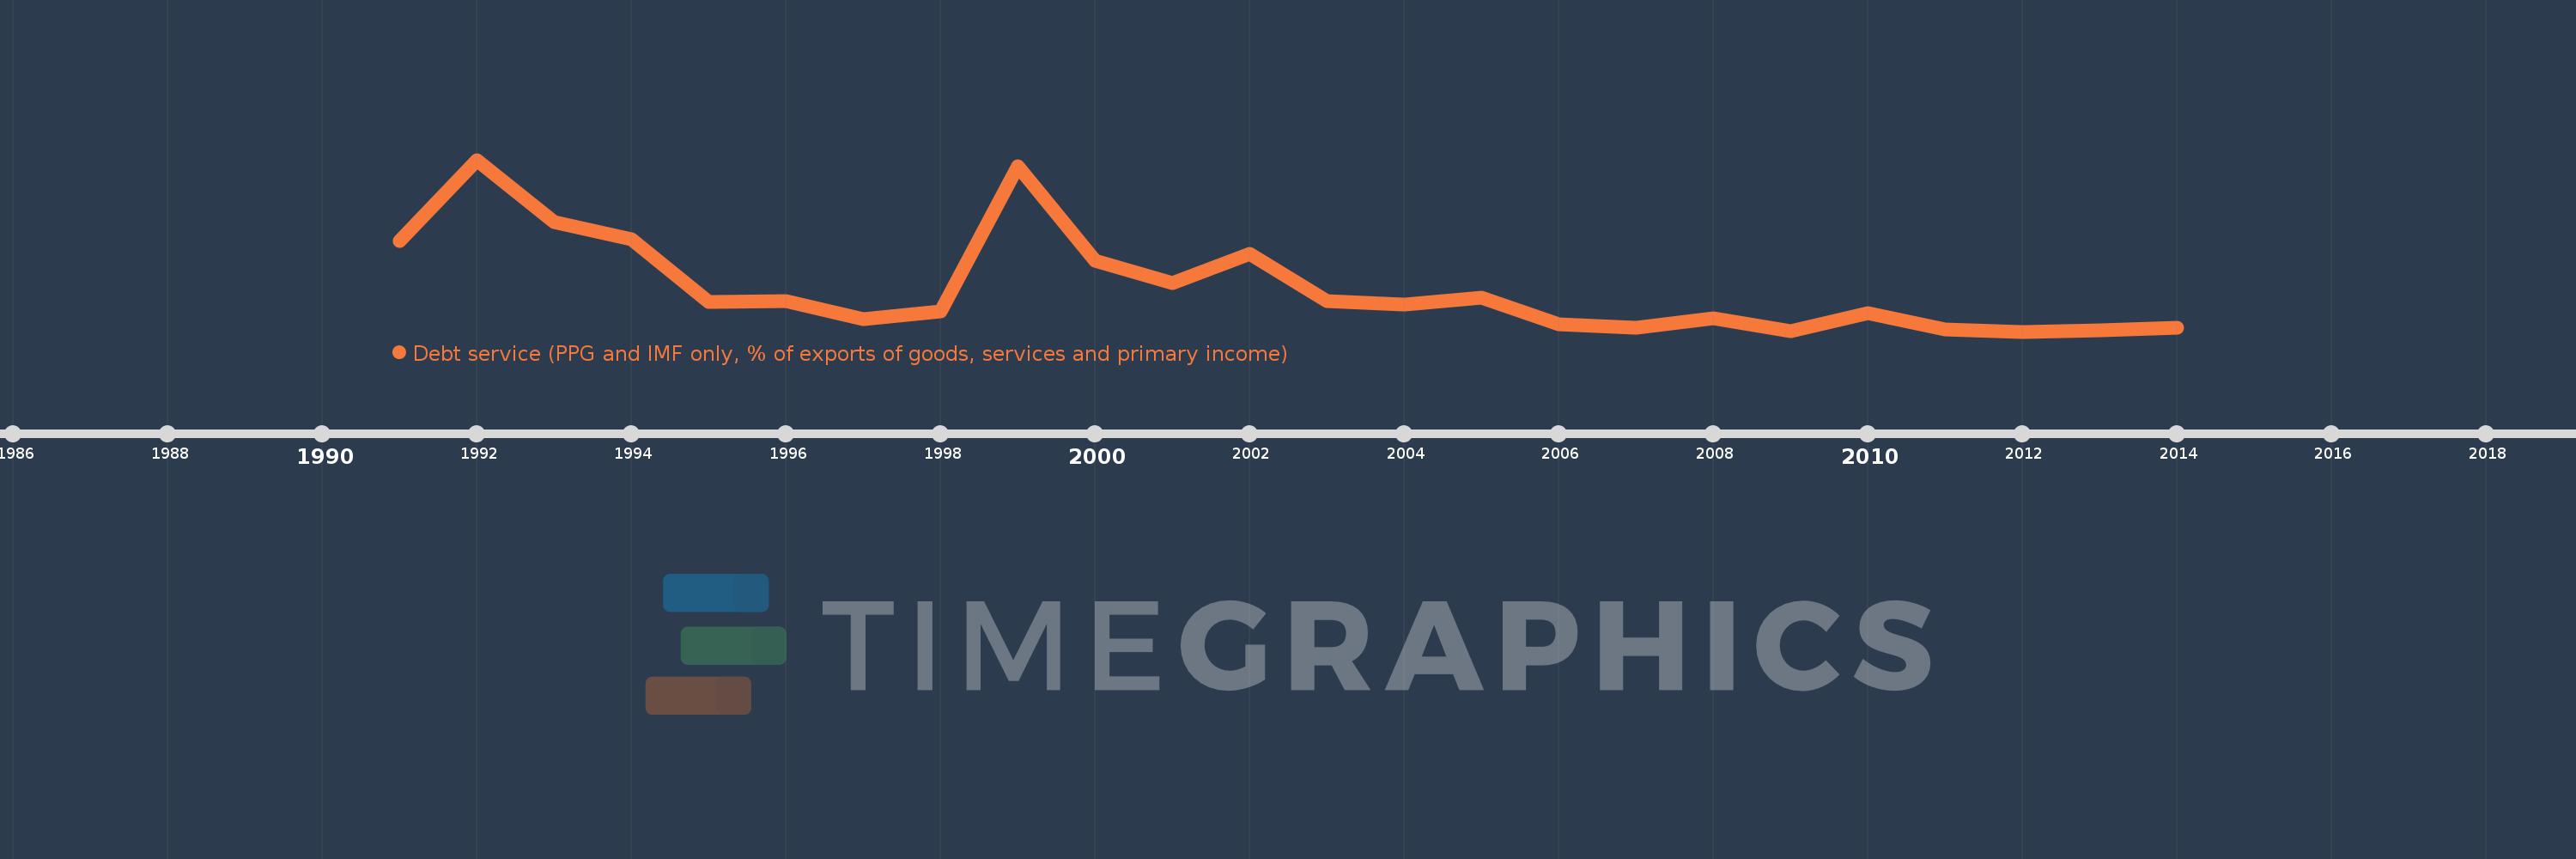
Debt service (PPG and IMF only, % of exports of goods, services and primary income)
2014,2013,2012,2011,2010,2009,2008,2007,2006,2005,2004,2003,2002,2001,2000,1999,1998,1997,1996,1995,1994,1993,1992,1991
Cette statistique dans les autres pays:
La ligne de temps
Cette échelle de temps montre un graphique de 1991 année à 2014 année Yemen, Rep.. Les données jusqu'à 1990 année ne sont pas présentés. Quantité d'observations actuelles selon dates: 24.
Source (désignation):
Les indicateurs du développement mondiale
Source (organisation):
World Bank, International Debt Statistics.
Catégories:
External Debt
Dernière mise à jour
23 avr. 2017
Les indicateurs de changement de valeurs selon les années
Minimum:
2.633
1 janv. 2012
Maximum:
11.166
1 janv. 1992
Pour la date d''observation
Valeur
Changement absolu
Le changement par rapport à la valeur précédente
1 janv. 1991
7.141
+7.141
0.0%
1 janv. 1992
11.166
+4.026
56.38%
1 janv. 1993
8.088
-3.078
-27.57%
1 janv. 1994
7.222
-0.866
-10.71%
1 janv. 1995
4.114
-3.108
-43.03%
1 janv. 1996
4.128
+0.014
0.33%
1 janv. 1997
3.267
-0.861
-20.85%
1 janv. 1998
3.642
+0.375
11.48%
1 janv. 1999
10.835
+7.193
197.49%
1 janv. 2000
6.134
-4.701
-43.39%
1 janv. 2001
5.038
-1.095
-17.86%
1 janv. 2002
6.473
+1.435
28.48%
1 janv. 2003
4.129
-2.344
-36.2%
1 janv. 2004
3.992
-0.138
-3.34%
1 janv. 2005
4.298
+0.306
7.67%
1 janv. 2006
3.002
-1.296
-30.16%
1 janv. 2007
2.84
-0.161
-5.37%
1 janv. 2008
3.29
+0.449
15.82%
1 janv. 2009
2.637
-0.652
-19.83%
1 janv. 2010
3.554
+0.917
34.78%
1 janv. 2011
2.754
-0.8
-22.51%
1 janv. 2012
2.633
-0.121
-4.4%
1 janv. 2013
2.699
+0.066
2.49%
1 janv. 2014
2.809
+0.11
4.07%
Classement des pays selon les statistiques actuelles par années


Commentaires: