29
/fr/
fr
AIzaSyAYiBZKx7MnpbEhh9jyipgxe19OcubqV5w
April 1, 2024
82616
Belize
BLZ
true
2
1
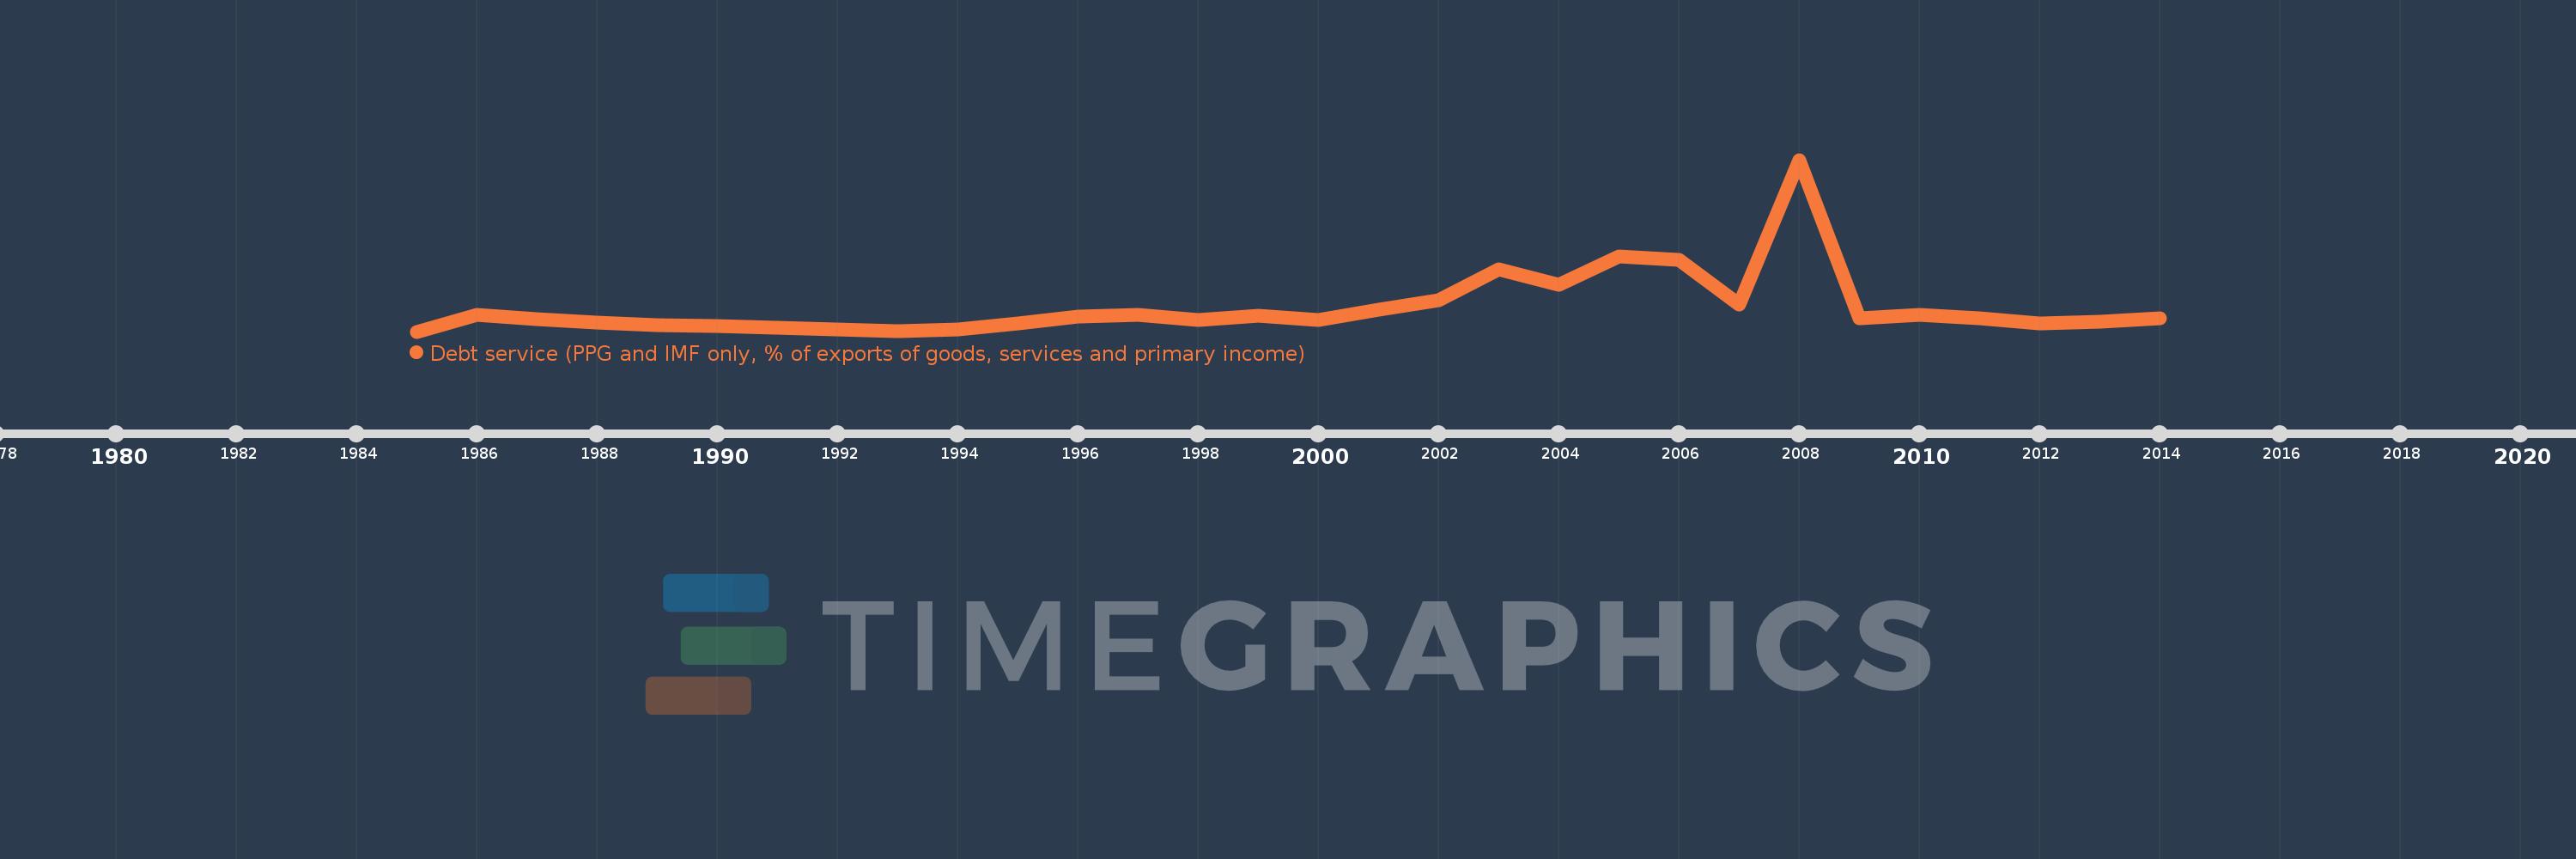
Debt service (PPG and IMF only, % of exports of goods, services and primary income)
2014,2013,2012,2011,2010,2009,2008,2007,2006,2005,2004,2003,2002,2001,2000,1999,1998,1997,1996,1995,1994,1993,1992,1991,1990,1989,1988,1987,1986,1985
Cette statistique dans les autres pays:
La ligne de temps
Cette échelle de temps montre un graphique de 1985 année à 2014 année Belize. Les données jusqu'à 1984 année ne sont pas présentés. Quantité d'observations actuelles selon dates: 30.
Source (désignation):
Les indicateurs du développement mondiale
Source (organisation):
World Bank, International Debt Statistics.
Catégories:
External Debt
Dernière mise à jour
23 avr. 2017
Les indicateurs de changement de valeurs selon les années
Minimum:
5.225
1 janv. 1985
Maximum:
78.123
1 janv. 2008
Pour la date d''observation
Valeur
Changement absolu
Le changement par rapport à la valeur précédente
1 janv. 1985
5.225
+5.225
0.0%
1 janv. 1986
12.491
+7.266
139.07%
1 janv. 1987
10.471
-2.02
-16.17%
1 janv. 1988
8.928
-1.543
-14.73%
1 janv. 1989
7.904
-1.024
-11.47%
1 janv. 1990
7.706
-0.198
-2.51%
1 janv. 1991
7.014
-0.692
-8.98%
1 janv. 1992
6.196
-0.818
-11.67%
1 janv. 1993
5.425
-0.771
-12.44%
1 janv. 1994
5.993
+0.567
10.46%
1 janv. 1995
8.522
+2.529
42.2%
1 janv. 1996
11.744
+3.223
37.82%
1 janv. 1997
12.182
+0.437
3.72%
1 janv. 1998
10.282
-1.899
-15.59%
1 janv. 1999
12.028
+1.745
16.97%
1 janv. 2000
10.092
-1.935
-16.09%
1 janv. 2001
14.525
+4.433
43.93%
1 janv. 2002
18.48
+3.955
27.23%
1 janv. 2003
31.62
+13.14
71.11%
1 janv. 2004
24.927
-6.692
-21.17%
1 janv. 2005
37.059
+12.132
48.67%
1 janv. 2006
35.705
-1.354
-3.65%
1 janv. 2007
16.717
-18.988
-53.18%
1 janv. 2008
78.123
+61.406
367.32%
1 janv. 2009
10.865
-67.258
-86.09%
1 janv. 2010
12.294
+1.429
13.15%
1 janv. 2011
10.896
-1.398
-11.37%
1 janv. 2012
8.796
-2.099
-19.27%
1 janv. 2013
9.27
+0.473
5.38%
1 janv. 2014
10.784
+1.514
16.33%
Classement des pays selon les statistiques actuelles par années


Commentaires: