29
/fr/
fr
AIzaSyAYiBZKx7MnpbEhh9jyipgxe19OcubqV5w
April 1, 2024
90966
Brazil
BRA
true
2
1
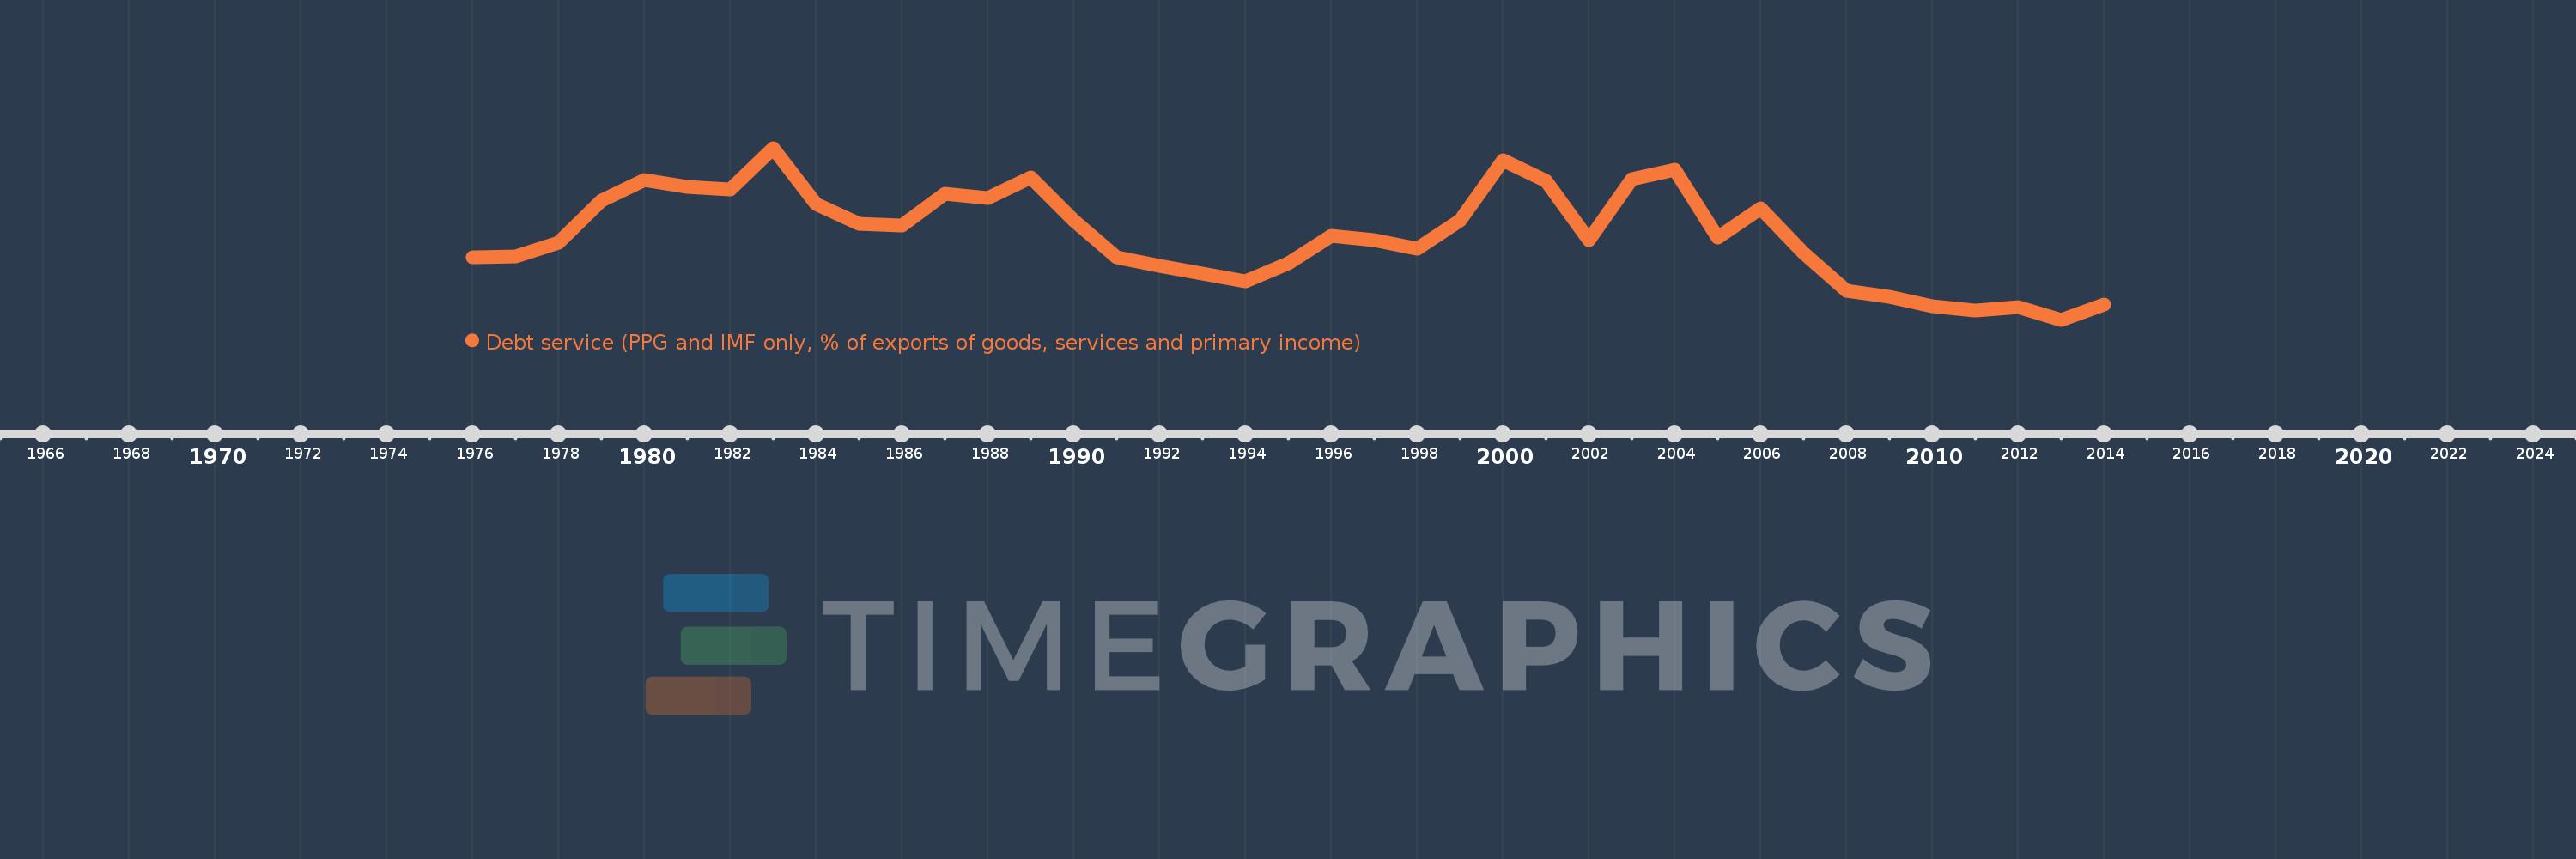
Debt service (PPG and IMF only, % of exports of goods, services and primary income)
2014,2013,2012,2011,2010,2009,2008,2007,2006,2005,2004,2003,2002,2001,2000,1999,1998,1997,1996,1995,1994,1993,1992,1991,1990,1989,1988,1987,1986,1985,1984,1983,1982,1981,1980,1979,1978,1977,1976
Cette statistique dans les autres pays:
La ligne de temps
Cette échelle de temps montre un graphique de 1976 année à 2014 année Brazil. Les données jusqu'à 1975 année ne sont pas présentés. Quantité d'observations actuelles selon dates: 39.
Source (désignation):
Les indicateurs du développement mondiale
Source (organisation):
World Bank, International Debt Statistics.
Catégories:
External Debt
Dernière mise à jour
23 avr. 2017
Les indicateurs de changement de valeurs selon les années
Minimum:
3.995
1 janv. 2013
Maximum:
44.244
1 janv. 1983
Pour la date d''observation
Valeur
Changement absolu
Le changement par rapport à la valeur précédente
1 janv. 1976
18.535
+18.535
0.0%
1 janv. 1977
18.865
+0.33
1.78%
1 janv. 1978
21.965
+3.1
16.43%
1 janv. 1979
31.893
+9.929
45.2%
1 janv. 1980
36.818
+4.925
15.44%
1 janv. 1981
35.167
-1.651
-4.48%
1 janv. 1982
34.516
-0.651
-1.85%
1 janv. 1983
44.244
+9.728
28.18%
1 janv. 1984
31.008
-13.236
-29.92%
1 janv. 1985
26.528
-4.479
-14.45%
1 janv. 1986
26.157
-0.371
-1.4%
1 janv. 1987
33.496
+7.339
28.06%
1 janv. 1988
32.456
-1.04
-3.11%
1 janv. 1989
37.356
+4.9
15.1%
1 janv. 1990
27.261
-10.094
-27.02%
1 janv. 1991
18.598
-8.664
-31.78%
1 janv. 1992
16.636
-1.961
-10.55%
1 janv. 1993
14.724
-1.912
-11.49%
1 janv. 1994
13.074
-1.65
-11.2%
1 janv. 1995
17.232
+4.158
31.8%
1 janv. 1996
23.65
+6.418
37.24%
1 janv. 1997
22.599
-1.051
-4.44%
1 janv. 1998
20.709
-1.889
-8.36%
1 janv. 1999
27.321
+6.611
31.92%
1 janv. 2000
41.383
+14.063
51.47%
1 janv. 2001
36.544
-4.839
-11.69%
1 janv. 2002
22.583
-13.961
-38.2%
1 janv. 2003
36.891
+14.308
63.36%
1 janv. 2004
39.066
+2.175
5.9%
1 janv. 2005
23.261
-15.805
-40.46%
1 janv. 2006
30.166
+6.905
29.68%
1 janv. 2007
19.535
-10.63
-35.24%
1 janv. 2008
10.822
-8.714
-44.6%
1 janv. 2009
9.303
-1.519
-14.03%
1 janv. 2010
7.096
-2.207
-23.73%
1 janv. 2011
6.148
-0.947
-13.35%
1 janv. 2012
6.984
+0.836
13.59%
1 janv. 2013
3.995
-2.99
-42.81%
1 janv. 2014
7.613
+3.618
90.57%
Classement des pays selon les statistiques actuelles par années


Commentaires: