29
/fr/
fr
AIzaSyAYiBZKx7MnpbEhh9jyipgxe19OcubqV5w
April 1, 2024
188875
Maldives
MDV
true
2
1
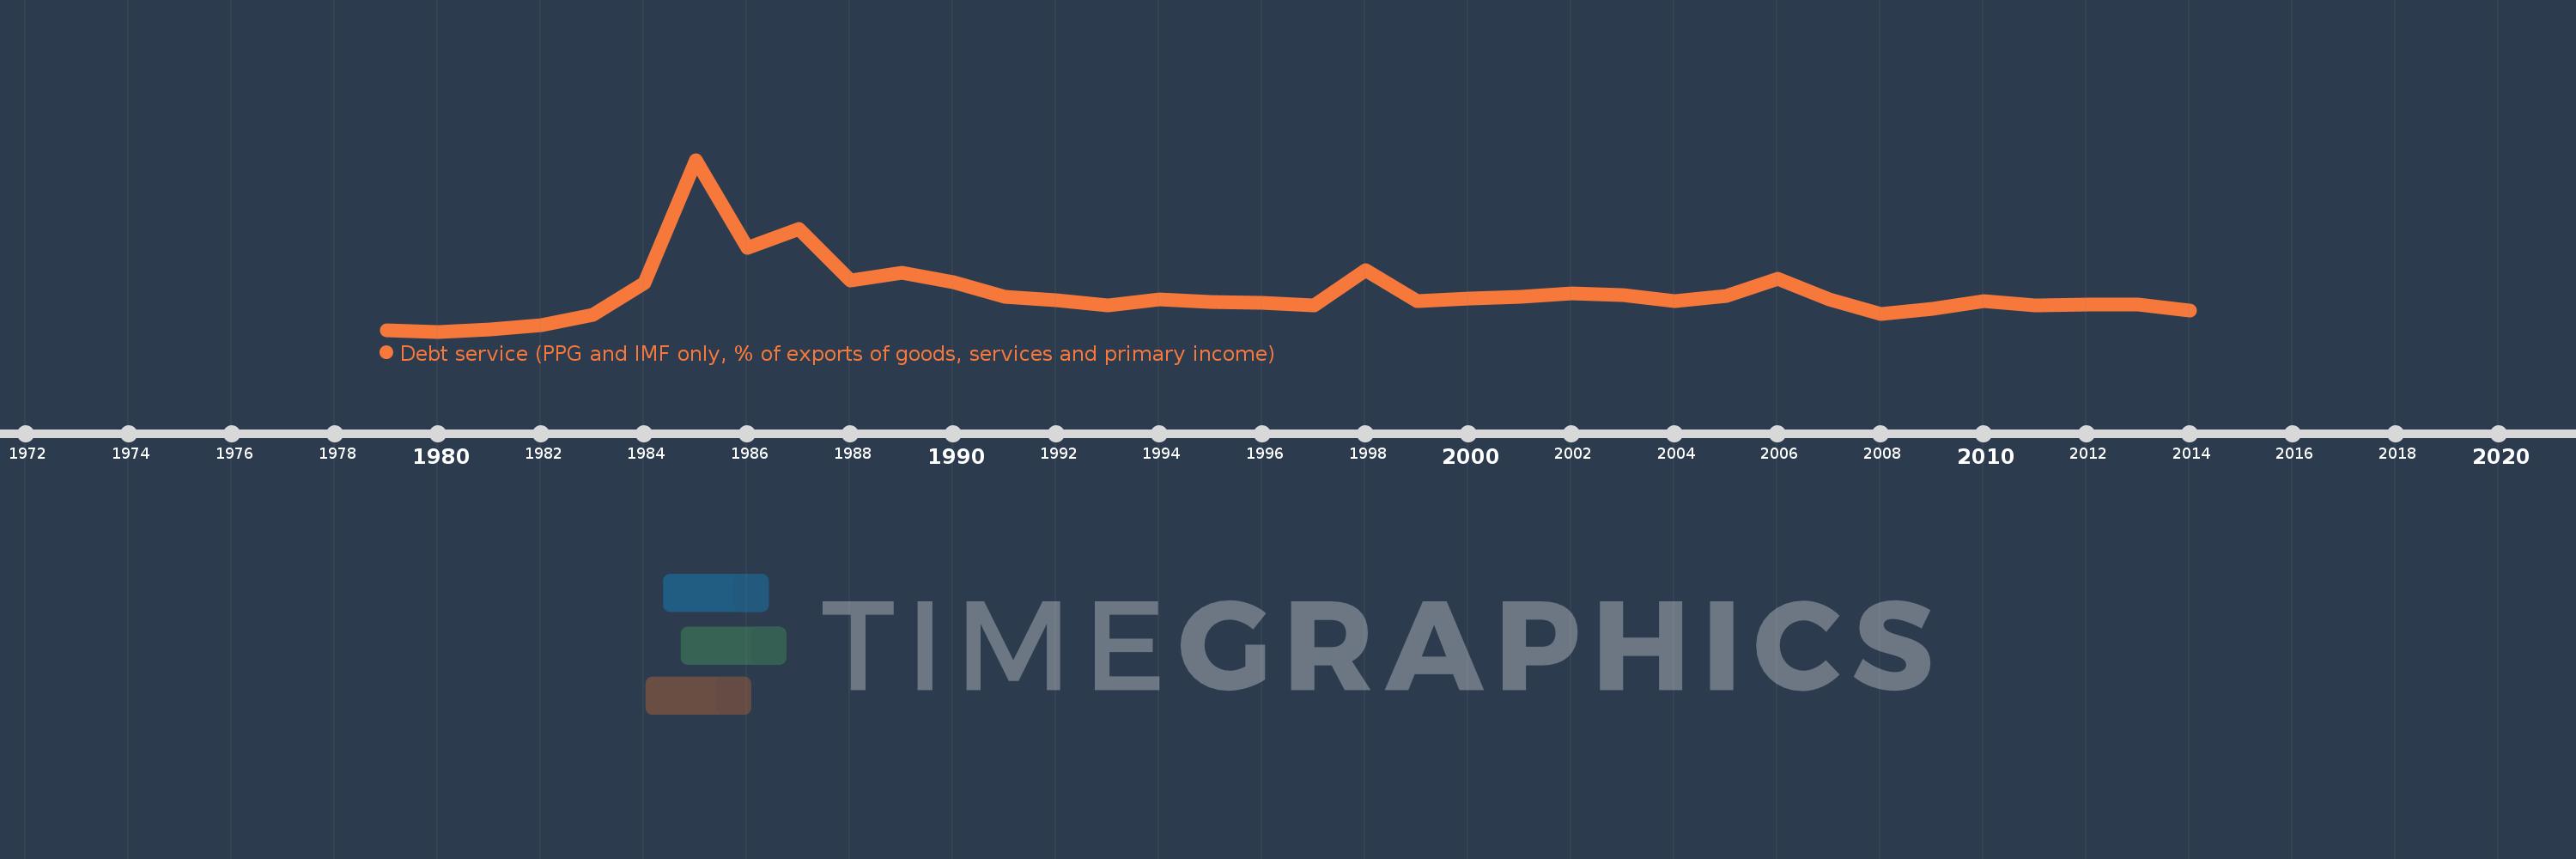
Debt service (PPG and IMF only, % of exports of goods, services and primary income)
2014,2013,2012,2011,2010,2009,2008,2007,2006,2005,2004,2003,2002,2001,2000,1999,1998,1997,1996,1995,1994,1993,1992,1991,1990,1989,1988,1987,1986,1985,1984,1983,1982,1981,1980,1979
Cette statistique dans les autres pays:
La ligne de temps
Cette échelle de temps montre un graphique de 1979 année à 2014 année Maldives. Les données jusqu'à 1978 année ne sont pas présentés. Quantité d'observations actuelles selon dates: 36.
Source (désignation):
Les indicateurs du développement mondiale
Source (organisation):
World Bank, International Debt Statistics.
Catégories:
External Debt
Dernière mise à jour
23 avr. 2017
Les indicateurs de changement de valeurs selon les années
Minimum:
0.184
1 janv. 1980
Maximum:
18.94
1 janv. 1985
Pour la date d''observation
Valeur
Changement absolu
Le changement par rapport à la valeur précédente
1 janv. 1979
0.344
+0.344
0.0%
1 janv. 1980
0.184
-0.16
-46.41%
1 janv. 1981
0.434
+0.25
135.63%
1 janv. 1982
0.899
+0.465
107.2%
1 janv. 1983
2.034
+1.134
126.14%
1 janv. 1984
5.515
+3.481
171.17%
1 janv. 1985
18.94
+13.425
243.43%
1 janv. 1986
9.316
-9.624
-50.81%
1 janv. 1987
11.426
+2.11
22.65%
1 janv. 1988
5.729
-5.697
-49.86%
1 janv. 1989
6.6
+0.871
15.2%
1 janv. 1990
5.608
-0.992
-15.03%
1 janv. 1991
3.987
-1.621
-28.91%
1 janv. 1992
3.639
-0.348
-8.73%
1 janv. 1993
3.046
-0.593
-16.3%
1 janv. 1994
3.738
+0.692
22.72%
1 janv. 1995
3.375
-0.363
-9.7%
1 janv. 1996
3.312
-0.064
-1.89%
1 janv. 1997
3.07
-0.241
-7.28%
1 janv. 1998
6.9
+3.83
124.73%
1 janv. 1999
3.56
-3.34
-48.4%
1 janv. 2000
3.779
+0.219
6.14%
1 janv. 2001
3.994
+0.215
5.69%
1 janv. 2002
4.314
+0.319
8.0%
1 janv. 2003
4.18
-0.133
-3.09%
1 janv. 2004
3.52
-0.66
-15.79%
1 janv. 2005
4.039
+0.519
14.73%
1 janv. 2006
5.919
+1.88
46.54%
1 janv. 2007
3.733
-2.187
-36.94%
1 janv. 2008
2.132
-1.6
-42.88%
1 janv. 2009
2.679
+0.547
25.68%
1 janv. 2010
3.476
+0.796
29.72%
1 janv. 2011
3.034
-0.441
-12.7%
1 janv. 2012
3.157
+0.123
4.04%
1 janv. 2013
3.144
-0.013
-0.41%
1 janv. 2014
2.457
-0.687
-21.86%
Classement des pays selon les statistiques actuelles par années


Commentaires: