29
/pt/
pt
AIzaSyAYiBZKx7MnpbEhh9jyipgxe19OcubqV5w
April 1, 2024
251772
St. Vincent and the Grenadines
VCT
true
2
1
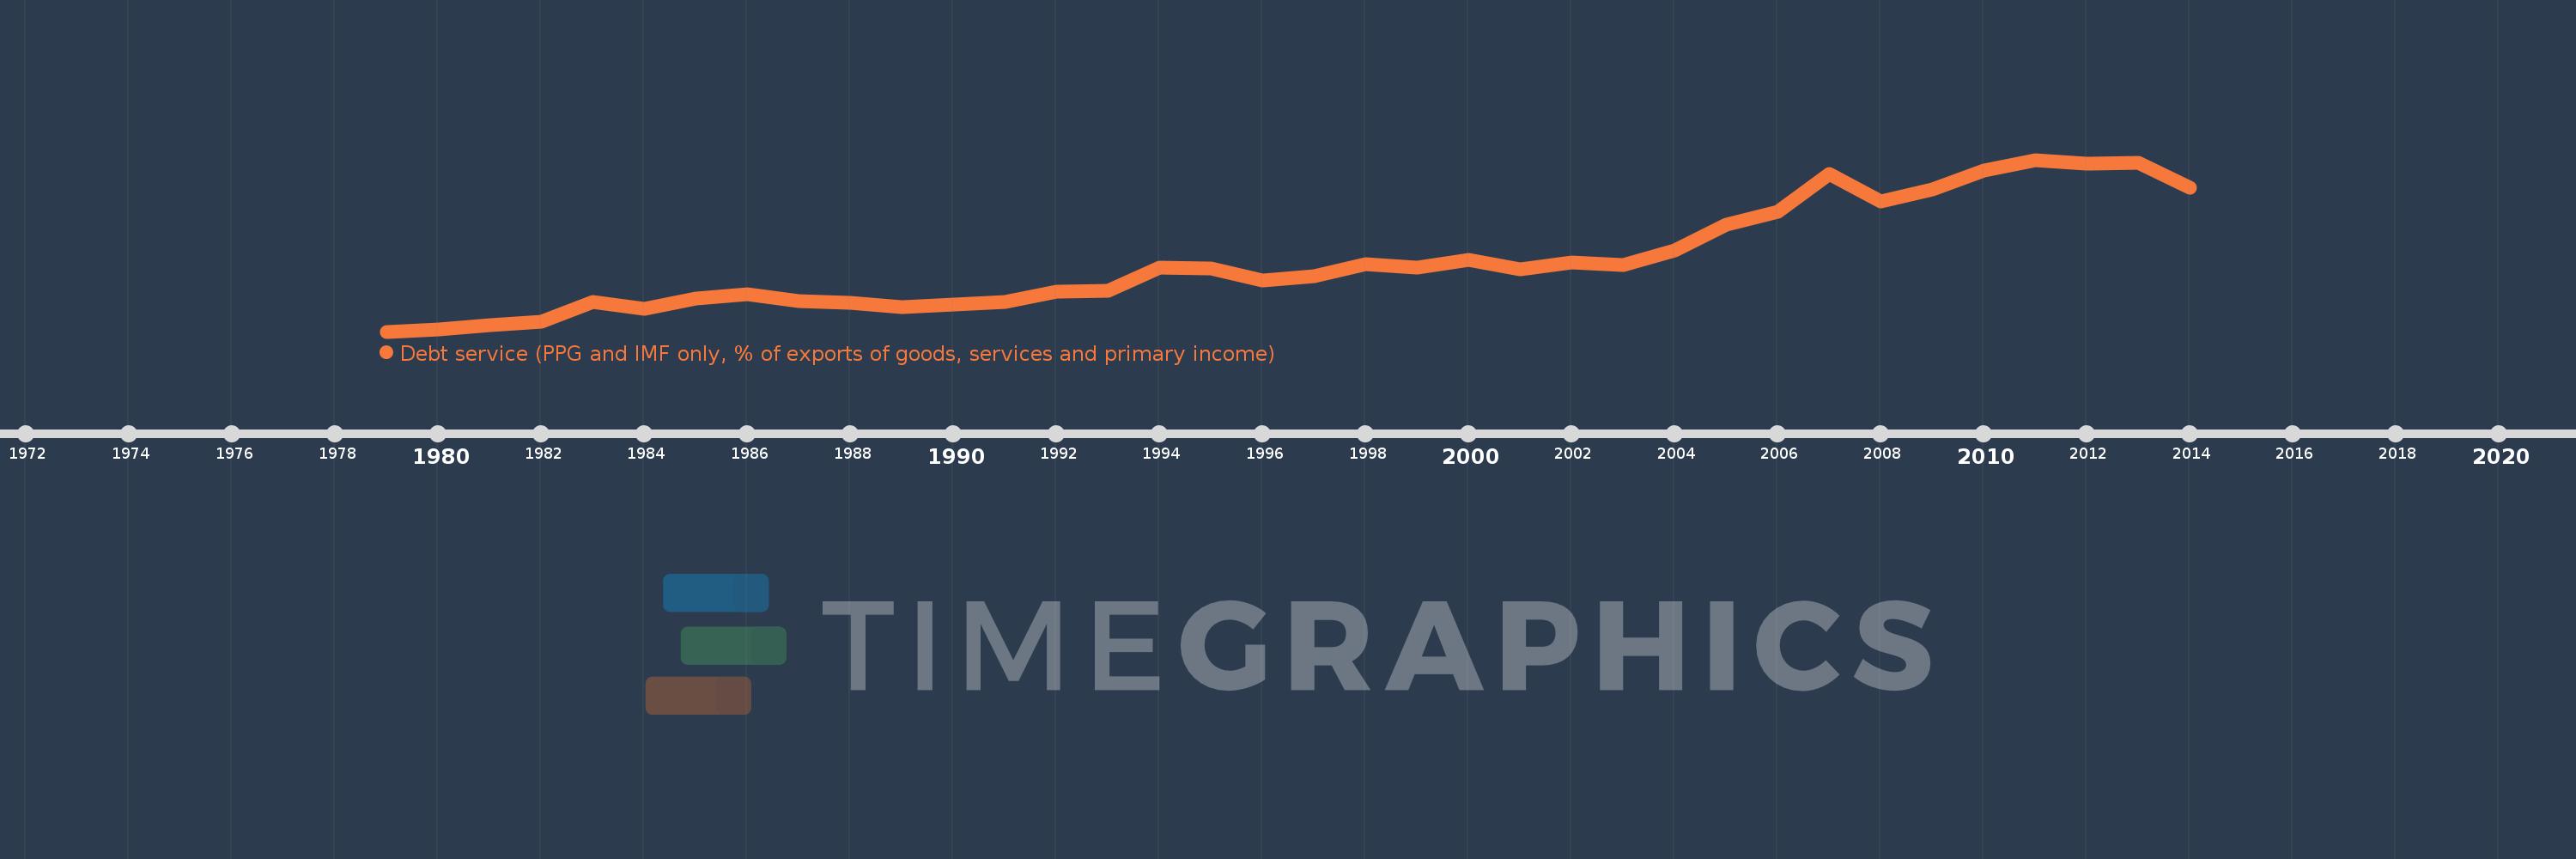
Debt service (PPG and IMF only, % of exports of goods, services and primary income)
2014,2013,2012,2011,2010,2009,2008,2007,2006,2005,2004,2003,2002,2001,2000,1999,1998,1997,1996,1995,1994,1993,1992,1991,1990,1989,1988,1987,1986,1985,1984,1983,1982,1981,1980,1979
Estas estatísticas em outros países:
Linha do tempo:
Nesta escala de tempo está apresentado um gráfico de 1979 ano até 2014 ano St. Vincent and the Grenadines. Dados de 1978 ano ausente. O número de observações reais por data: 36.
Fonte (nome):
Indicadores de desenvolvimento mundial
Fonte (organização):
World Bank, International Debt Statistics.
Categorias:
External Debt
Foi atualizado:
23 abr 2017 ano
Indicadores de alterações dos valores ao longo dos anos
Mínimo:
0.456
1 jan 1979 ano
Máximo:
16.073
1 jan 2011 ano
Na data de observação
Valor
Mudança absoluta
A alteração em relação ao valor anterior
1 jan 1979 ano
0.456
+0.456
0.0%
1 jan 1980 ano
0.677
+0.221
48.46%
1 jan 1981 ano
1.066
+0.389
57.49%
1 jan 1982 ano
1.377
+0.312
29.24%
1 jan 1983 ano
3.144
+1.767
128.29%
1 jan 1984 ano
2.519
-0.625
-19.87%
1 jan 1985 ano
3.458
+0.939
37.25%
1 jan 1986 ano
3.862
+0.404
11.68%
1 jan 1987 ano
3.256
-0.606
-15.69%
1 jan 1988 ano
3.058
-0.198
-6.08%
1 jan 1989 ano
2.686
-0.372
-12.16%
1 jan 1990 ano
2.936
+0.249
9.28%
1 jan 1991 ano
3.135
+0.2
6.8%
1 jan 1992 ano
4.05
+0.915
29.18%
1 jan 1993 ano
4.133
+0.083
2.06%
1 jan 1994 ano
6.305
+2.172
52.55%
1 jan 1995 ano
6.23
-0.075
-1.19%
1 jan 1996 ano
5.096
-1.134
-18.2%
1 jan 1997 ano
5.481
+0.385
7.55%
1 jan 1998 ano
6.554
+1.073
19.57%
1 jan 1999 ano
6.242
-0.312
-4.75%
1 jan 2000 ano
6.981
+0.739
11.84%
1 jan 2001 ano
6.154
-0.827
-11.85%
1 jan 2002 ano
6.723
+0.569
9.25%
1 jan 2003 ano
6.51
-0.213
-3.16%
1 jan 2004 ano
7.8
+1.29
19.82%
1 jan 2005 ano
10.198
+2.398
30.74%
1 jan 2006 ano
11.318
+1.12
10.98%
1 jan 2007 ano
14.78
+3.462
30.59%
1 jan 2008 ano
12.319
-2.461
-16.65%
1 jan 2009 ano
13.353
+1.034
8.39%
1 jan 2010 ano
15.128
+1.775
13.29%
1 jan 2011 ano
16.073
+0.945
6.25%
1 jan 2012 ano
15.756
-0.316
-1.97%
1 jan 2013 ano
15.784
+0.028
0.18%
1 jan 2014 ano
13.547
-2.237
-14.18%
Classificação de países por estatísticas atuais por anos


Comentários: