29
/pt/
pt
AIzaSyAYiBZKx7MnpbEhh9jyipgxe19OcubqV5w
April 1, 2024
162386
Jamaica
JAM
true
2
1
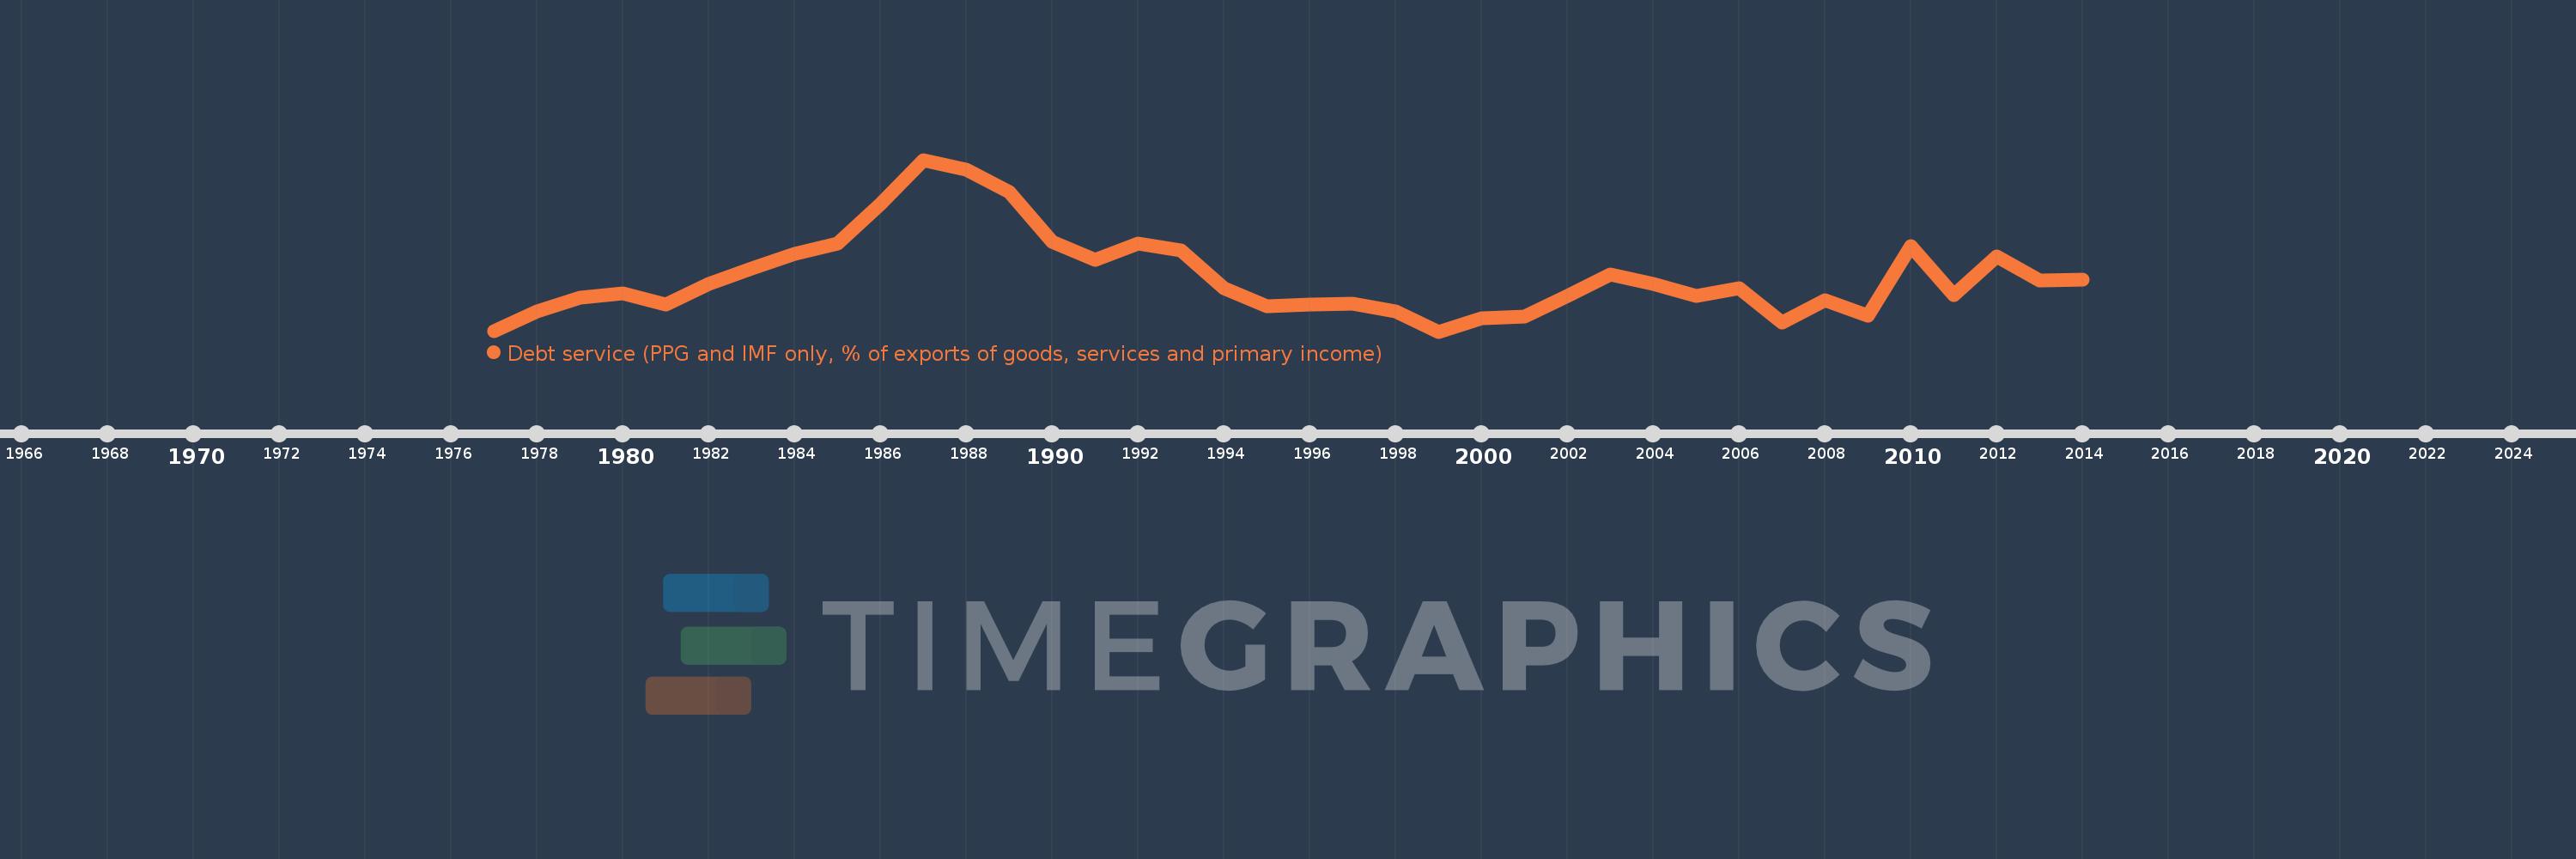
Debt service (PPG and IMF only, % of exports of goods, services and primary income)
2014,2013,2012,2011,2010,2009,2008,2007,2006,2005,2004,2003,2002,2001,2000,1999,1998,1997,1996,1995,1994,1993,1992,1991,1990,1989,1988,1987,1986,1985,1984,1983,1982,1981,1980,1979,1978,1977
Estas estatísticas em outros países:
Linha do tempo:
Nesta escala de tempo está apresentado um gráfico de 1977 ano até 2014 ano Jamaica. Dados de 1976 ano ausente. O número de observações reais por data: 38.
Fonte (nome):
Indicadores de desenvolvimento mundial
Fonte (organização):
World Bank, International Debt Statistics.
Categorias:
External Debt
Foi atualizado:
23 abr 2017 ano
Indicadores de alterações dos valores ao longo dos anos
Mínimo:
12.193
1 jan 1999 ano
Máximo:
46.007
1 jan 1987 ano
Na data de observação
Valor
Mudança absoluta
A alteração em relação ao valor anterior
1 jan 1977 ano
12.244
+12.244
0.0%
1 jan 1978 ano
16.21
+3.966
32.4%
1 jan 1979 ano
18.822
+2.612
16.11%
1 jan 1980 ano
19.737
+0.915
4.86%
1 jan 1981 ano
17.493
-2.244
-11.37%
1 jan 1982 ano
21.639
+4.145
23.7%
1 jan 1983 ano
24.685
+3.046
14.08%
1 jan 1984 ano
27.513
+2.828
11.46%
1 jan 1985 ano
29.503
+1.99
7.23%
1 jan 1986 ano
37.291
+7.788
26.4%
1 jan 1987 ano
46.007
+8.716
23.37%
1 jan 1988 ano
44.117
-1.889
-4.11%
1 jan 1989 ano
39.648
-4.47
-10.13%
1 jan 1990 ano
29.916
-9.732
-24.55%
1 jan 1991 ano
26.35
-3.565
-11.92%
1 jan 1992 ano
29.478
+3.127
11.87%
1 jan 1993 ano
28.143
-1.334
-4.53%
1 jan 1994 ano
20.776
-7.367
-26.18%
1 jan 1995 ano
17.191
-3.585
-17.25%
1 jan 1996 ano
17.512
+0.321
1.87%
1 jan 1997 ano
17.63
+0.118
0.67%
1 jan 1998 ano
16.166
-1.464
-8.3%
1 jan 1999 ano
12.193
-3.973
-24.58%
1 jan 2000 ano
14.778
+2.585
21.2%
1 jan 2001 ano
15.165
+0.387
2.62%
1 jan 2002 ano
19.195
+4.031
26.58%
1 jan 2003 ano
23.421
+4.226
22.01%
1 jan 2004 ano
21.513
-1.908
-8.15%
1 jan 2005 ano
19.291
-2.222
-10.33%
1 jan 2006 ano
20.681
+1.39
7.2%
1 jan 2007 ano
13.959
-6.721
-32.5%
1 jan 2008 ano
18.295
+4.336
31.06%
1 jan 2009 ano
15.38
-2.915
-15.93%
1 jan 2010 ano
29.033
+13.653
88.77%
1 jan 2011 ano
19.45
-9.583
-33.01%
1 jan 2012 ano
26.966
+7.516
38.64%
1 jan 2013 ano
22.299
-4.667
-17.31%
1 jan 2014 ano
22.341
+0.042
0.19%
Classificação de países por estatísticas atuais por anos


Comentários: