29
/pt/
pt
AIzaSyAYiBZKx7MnpbEhh9jyipgxe19OcubqV5w
April 1, 2024
269146
Turkey
TUR
true
2
1
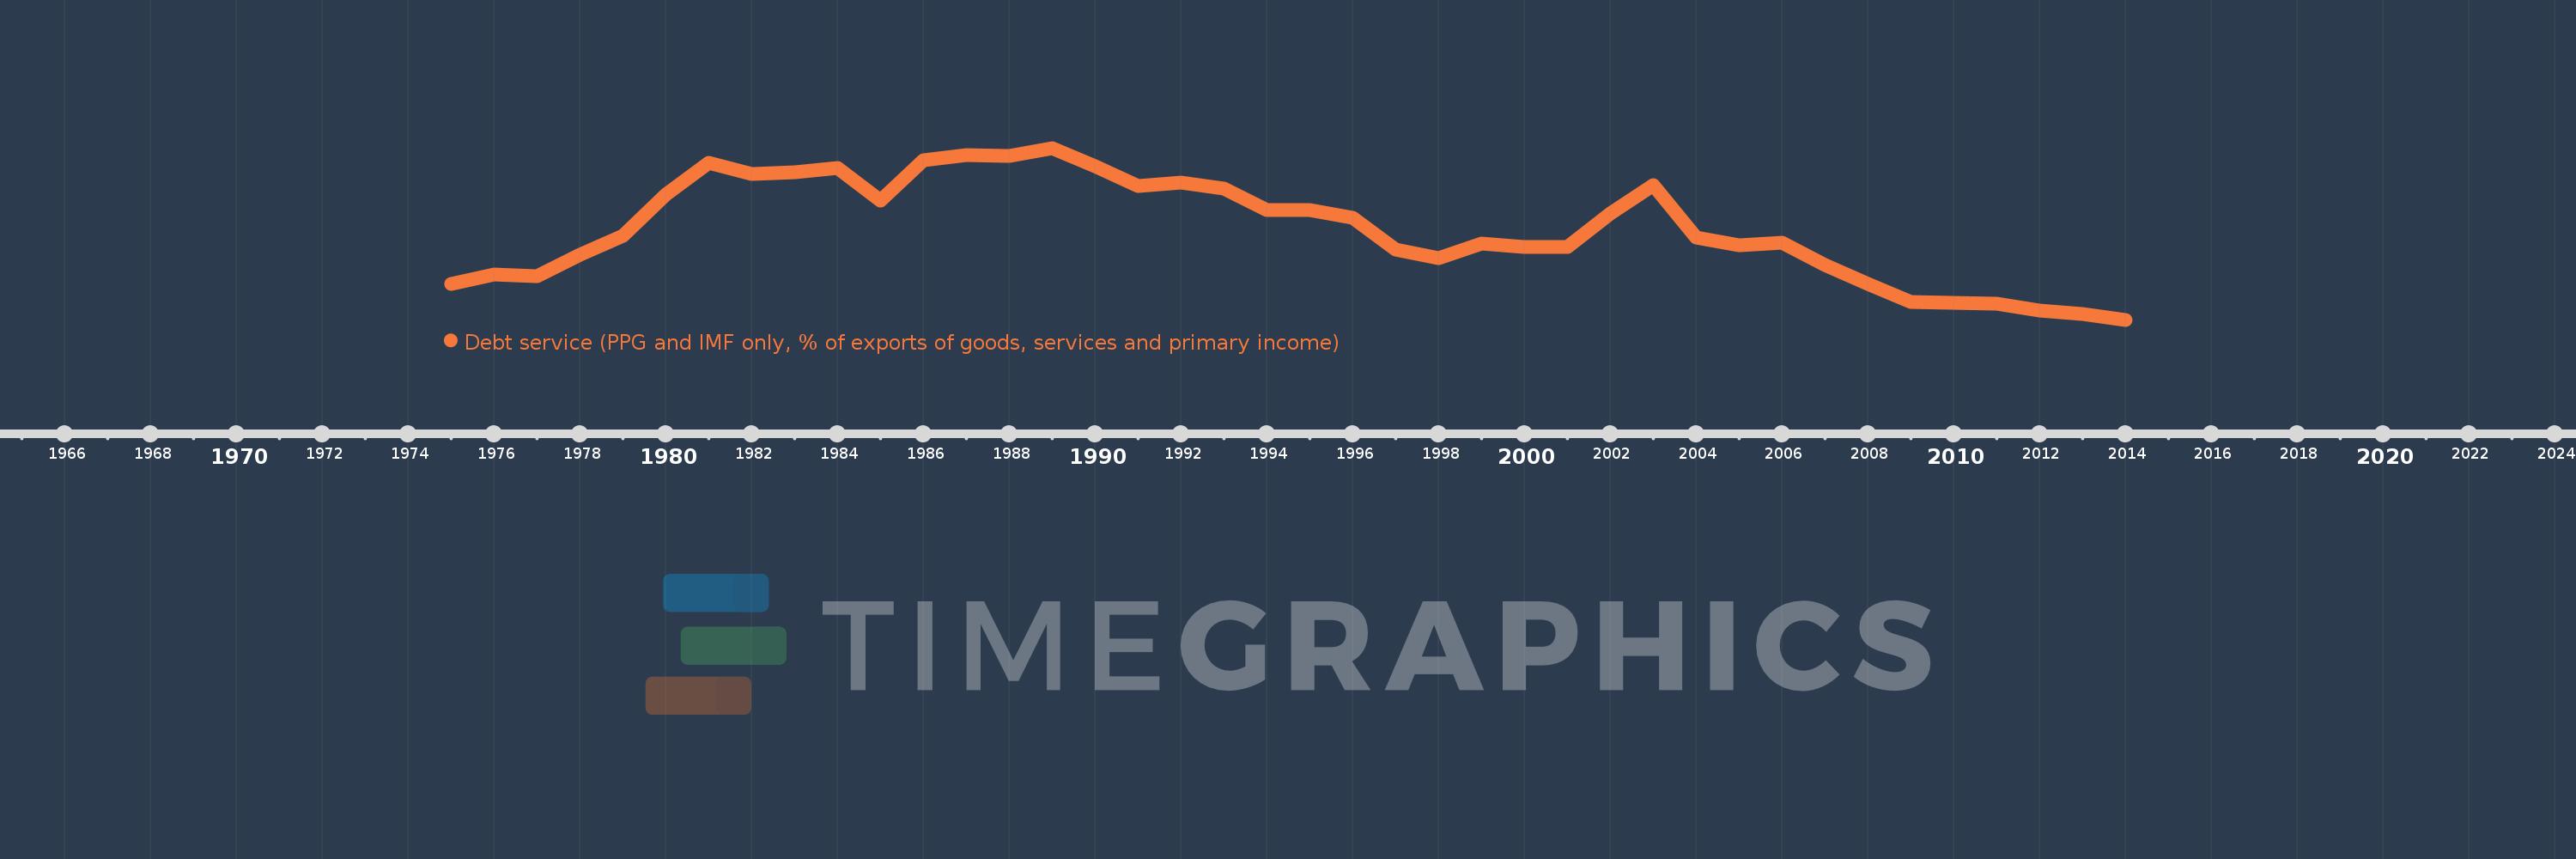
Debt service (PPG and IMF only, % of exports of goods, services and primary income)
2014,2013,2012,2011,2010,2009,2008,2007,2006,2005,2004,2003,2002,2001,2000,1999,1998,1997,1996,1995,1994,1993,1992,1991,1990,1989,1988,1987,1986,1985,1984,1983,1982,1981,1980,1979,1978,1977,1976,1975
Estas estatísticas em outros países:
Linha do tempo:
Nesta escala de tempo está apresentado um gráfico de 1975 ano até 2014 ano Turkey. Dados de 1974 ano ausente. O número de observações reais por data: 40.
Fonte (nome):
Indicadores de desenvolvimento mundial
Fonte (organização):
World Bank, International Debt Statistics.
Categorias:
External Debt
Foi atualizado:
23 abr 2017 ano
Indicadores de alterações dos valores ao longo dos anos
Mínimo:
4.882
1 jan 2014 ano
Máximo:
37.034
1 jan 1989 ano
Na data de observação
Valor
Mudança absoluta
A alteração em relação ao valor anterior
1 jan 1975 ano
11.546
+11.546
0.0%
1 jan 1976 ano
13.34
+1.794
15.54%
1 jan 1977 ano
13.092
-0.248
-1.86%
1 jan 1978 ano
17.063
+3.972
30.34%
1 jan 1979 ano
20.537
+3.474
20.36%
1 jan 1980 ano
28.372
+7.834
38.15%
1 jan 1981 ano
34.293
+5.922
20.87%
1 jan 1982 ano
32.104
-2.189
-6.38%
1 jan 1983 ano
32.422
+0.318
0.99%
1 jan 1984 ano
33.268
+0.846
2.61%
1 jan 1985 ano
27.253
-6.015
-18.08%
1 jan 1986 ano
34.728
+7.475
27.43%
1 jan 1987 ano
35.683
+0.955
2.75%
1 jan 1988 ano
35.604
-0.079
-0.22%
1 jan 1989 ano
37.034
+1.431
4.02%
1 jan 1990 ano
33.674
-3.36
-9.07%
1 jan 1991 ano
29.876
-3.798
-11.28%
1 jan 1992 ano
30.518
+0.643
2.15%
1 jan 1993 ano
29.493
-1.025
-3.36%
1 jan 1994 ano
25.451
-4.043
-13.71%
1 jan 1995 ano
25.458
+0.007
0.03%
1 jan 1996 ano
24.001
-1.456
-5.72%
1 jan 1997 ano
17.988
-6.014
-25.06%
1 jan 1998 ano
16.394
-1.593
-8.86%
1 jan 1999 ano
19.07
+2.675
16.32%
1 jan 2000 ano
18.436
-0.634
-3.32%
1 jan 2001 ano
18.576
+0.14
0.76%
1 jan 2002 ano
24.755
+6.179
33.26%
1 jan 2003 ano
30.132
+5.377
21.72%
1 jan 2004 ano
20.326
-9.806
-32.54%
1 jan 2005 ano
18.869
-1.457
-7.17%
1 jan 2006 ano
19.245
+0.376
1.99%
1 jan 2007 ano
15.184
-4.061
-21.1%
1 jan 2008 ano
11.535
-3.648
-24.03%
1 jan 2009 ano
8.264
-3.271
-28.36%
1 jan 2010 ano
8.066
-0.198
-2.4%
1 jan 2011 ano
7.933
-0.133
-1.65%
1 jan 2012 ano
6.661
-1.272
-16.03%
1 jan 2013 ano
5.916
-0.745
-11.18%
1 jan 2014 ano
4.882
-1.034
-17.47%
Classificação de países por estatísticas atuais por anos


Comentários: