29
/pt/
pt
AIzaSyAYiBZKx7MnpbEhh9jyipgxe19OcubqV5w
April 1, 2024
73774
Austria
AUT
true
2
1
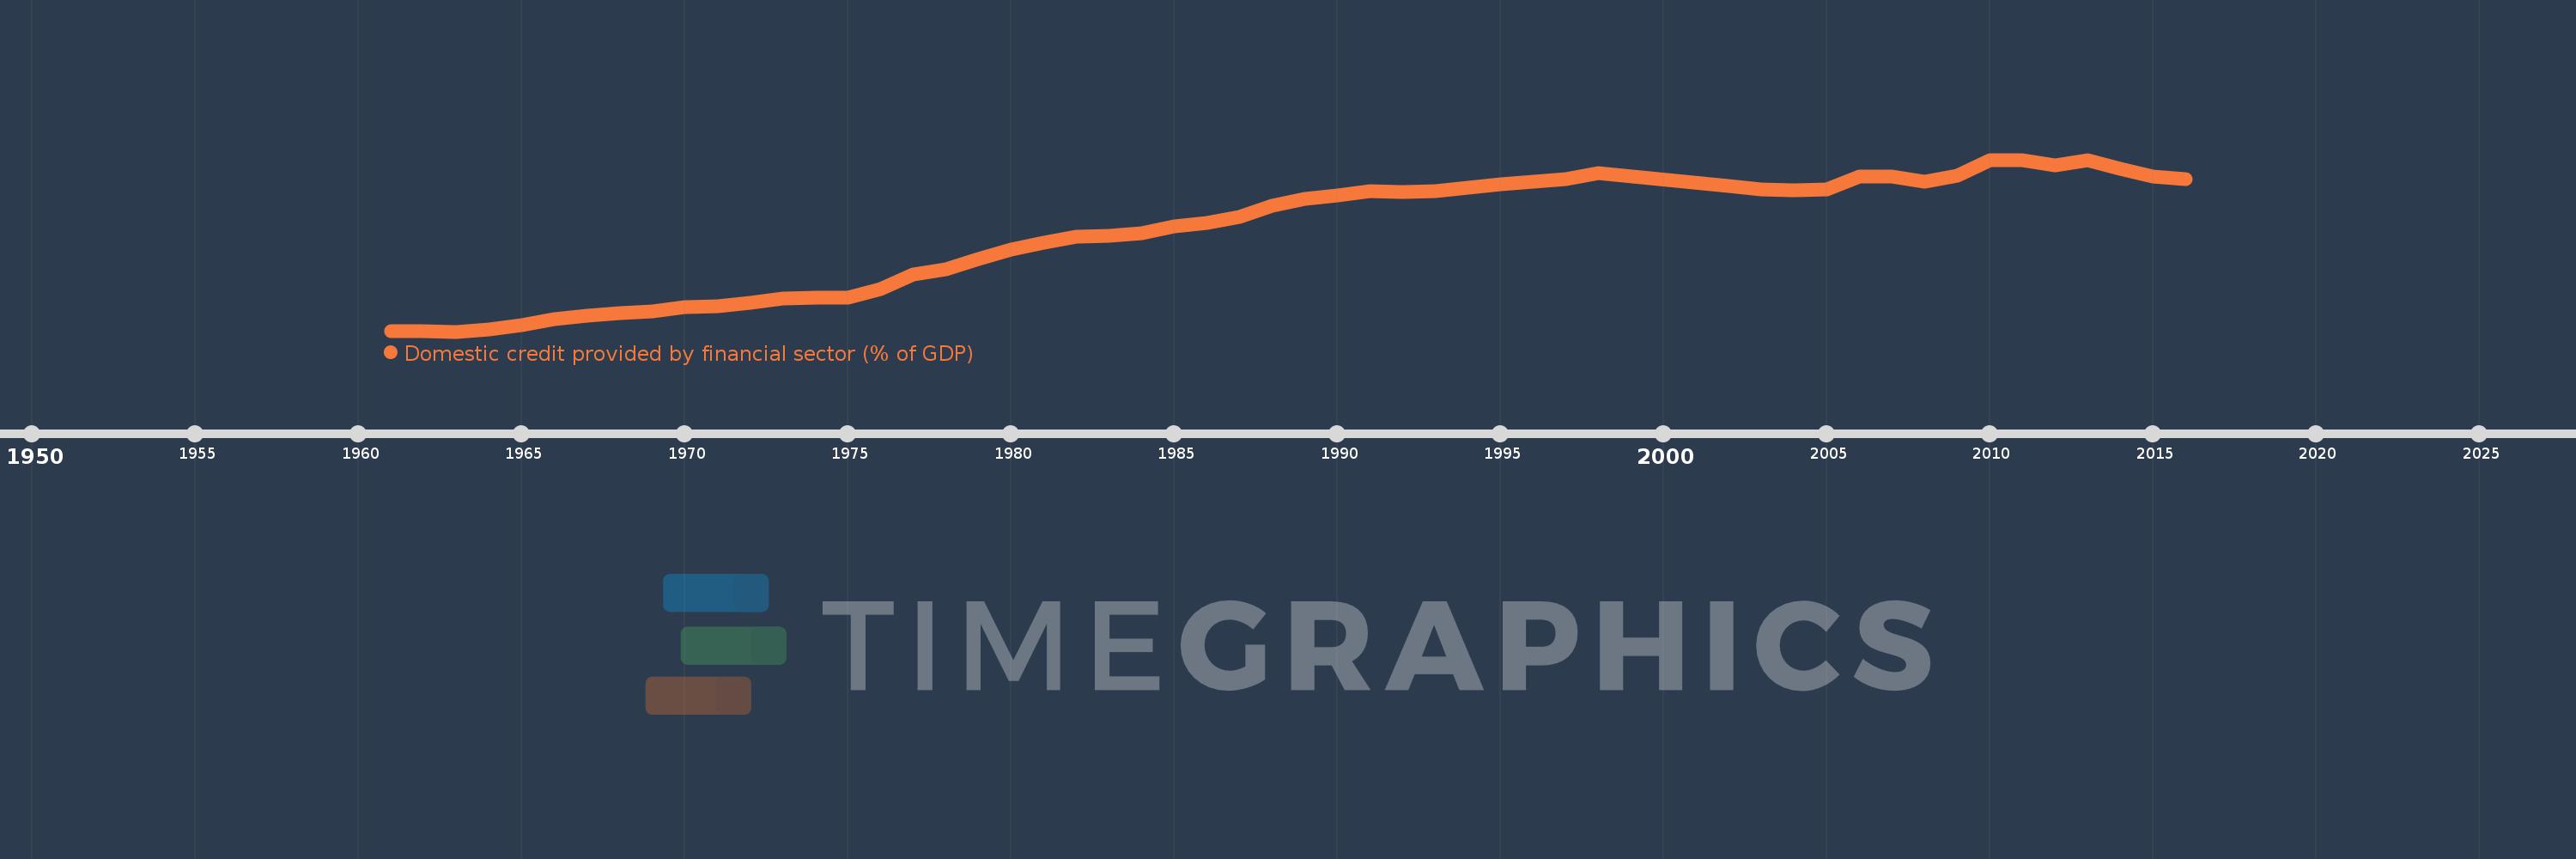
Domestic credit provided by financial sector (% of GDP)
2016,2015,2014,2013,2012,2011,2010,2009,2008,2007,2006,2005,2004,2003,2002,1998,1997,1996,1995,1994,1993,1992,1991,1990,1989,1988,1987,1986,1985,1984,1983,1982,1981,1980,1979,1978,1977,1976,1975,1974,1973,1972,1971,1970,1969,1968,1967,1966,1965,1964,1963,1962,1961
Estas estatísticas em outros países:
AfghanistanAlbaniaAlgeriaAngolaAntigua and BarbudaArab WorldArgentinaArmeniaArubaAustraliaAustriaAzerbaijanBahamas, TheBahrainBangladeshBarbadosBelarusBelgiumBelizeBeninBhutanBoliviaBosnia and HerzegovinaBotswanaBrazilBrunei DarussalamBulgariaBurkina FasoBurundiCabo VerdeCambodiaCameroonCanadaCaribbean small statesCentral African RepublicCentral Europe and the BalticsChadChileChinaColombiaComorosCongo, Dem. Rep.Congo, Rep.Costa RicaCote d'IvoireCroatiaCyprusCzech RepublicDenmarkDjiboutiDominicaDominican RepublicEarly-demographic dividendEast Asia & PacificEast Asia & Pacific (excluding high income)East Asia & Pacific (IDA & IBRD countries)EcuadorEgypt, Arab Rep.El SalvadorEquatorial GuineaEritreaEstoniaEthiopiaEuro areaEurope & Central AsiaEurope & Central Asia (excluding high income)Europe & Central Asia (IDA & IBRD countries)European UnionFijiFinlandFragile and conflict affected situationsFranceGabonGambia, TheGeorgiaGermanyGhanaGreeceGrenadaGuatemalaGuineaGuinea-BissauGuyanaHaitiHeavily indebted poor countries (HIPC)High incomeHondurasHong Kong SAR, ChinaHungaryIBRD onlyIcelandIDA & IBRD totalIDA blendIDA onlyIDA totalIndiaIndonesiaIran, Islamic Rep.IraqIrelandIsraelItalyJamaicaJapanJordanKazakhstanKenyaKorea, Rep.KosovoKuwaitKyrgyz RepublicLao PDRLate-demographic dividendLatin America & Caribbean Latin America & Caribbean (excluding high income)Latin America & the Caribbean (IDA & IBRD countries)LatviaLeast developed countries: UN classificationLebanonLesothoLiberiaLibyaLithuaniaLow & middle incomeLow incomeLower middle incomeLuxembourgMacao SAR, ChinaMacedonia, FYRMadagascarMalawiMalaysiaMaldivesMaliMaltaMauritaniaMauritiusMexicoMicronesia, Fed. Sts.Middle East & North AfricaMiddle East & North Africa (excluding high income)Middle East & North Africa (IDA & IBRD countries)Middle incomeMoldovaMongoliaMontenegroMoroccoMozambiqueMyanmarNamibiaNepalNetherlandsNew ZealandNicaraguaNigerNigeriaNorth AmericaNorwayOECD membersOmanOther small statesPacific island small statesPakistanPanamaPapua New GuineaParaguayPeruPhilippinesPolandPortugalPost-demographic dividendPre-demographic dividendQatarRomaniaRussian FederationRwandaSamoaSao Tome and PrincipeSaudi ArabiaSenegalSerbiaSeychellesSierra LeoneSingaporeSlovak RepublicSloveniaSmall statesSolomon IslandsSouth AfricaSouth AsiaSouth Asia (IDA & IBRD)South SudanSpainSri LankaSt. Kitts and NevisSt. LuciaSt. Vincent and the GrenadinesSub-Saharan Africa Sub-Saharan Africa (excluding high income)Sub-Saharan Africa (IDA & IBRD countries)SudanSurinameSwazilandSwedenSwitzerlandSyrian Arab RepublicTajikistanTanzaniaThailandTimor-LesteTogoTongaTrinidad and TobagoTunisiaTurkeyUgandaUkraineUnited Arab EmiratesUnited KingdomUnited StatesUpper middle incomeUruguayVanuatuVenezuela, RBVietnamWest Bank and GazaWorldYemen, Rep.ZambiaZimbabwe Linha do tempo:
Nesta escala de tempo está apresentado um gráfico de 1961 ano até 2016 ano Austria. Dados de 1960 ano ausente. O número de observações reais por data: 53.
Fonte (nome):
Indicadores de desenvolvimento mundial
Fonte (organização):
International Monetary Fund, International Financial Statistics and data files, and World Bank and OECD GDP estimates.
Categorias:
Financial Sector
Foi atualizado:
23 abr 2017 ano
Indicadores de alterações dos valores ao longo dos anos
Mínimo:
37.967
1 jan 1963 ano
Máximo:
135.968
1 jan 2010 ano
Na data de observação
Valor
Mudança absoluta
A alteração em relação ao valor anterior
1 jan 1961 ano
38.197
+38.197
0.0%
1 jan 1962 ano
38.215
+0.018
0.05%
1 jan 1963 ano
37.967
-0.249
-0.65%
1 jan 1964 ano
39.078
+1.112
2.93%
1 jan 1965 ano
41.848
+2.77
7.09%
1 jan 1966 ano
44.874
+3.026
7.23%
1 jan 1967 ano
47.162
+2.288
5.1%
1 jan 1968 ano
48.415
+1.253
2.66%
1 jan 1969 ano
49.419
+1.004
2.07%
1 jan 1970 ano
51.97
+2.551
5.16%
1 jan 1971 ano
52.454
+0.484
0.93%
1 jan 1972 ano
54.462
+2.007
3.83%
1 jan 1973 ano
56.62
+2.159
3.96%
1 jan 1974 ano
57.104
+0.483
0.85%
1 jan 1975 ano
57.553
+0.449
0.79%
1 jan 1976 ano
62.196
+4.644
8.07%
1 jan 1977 ano
70.35
+8.153
13.11%
1 jan 1978 ano
73.708
+3.358
4.77%
1 jan 1979 ano
79.265
+5.557
7.54%
1 jan 1980 ano
84.895
+5.63
7.1%
1 jan 1981 ano
88.674
+3.78
4.45%
1 jan 1982 ano
91.91
+3.236
3.65%
1 jan 1983 ano
92.555
+0.645
0.7%
1 jan 1984 ano
94.097
+1.542
1.67%
1 jan 1985 ano
98.109
+4.012
4.26%
1 jan 1986 ano
100.171
+2.062
2.1%
1 jan 1987 ano
103.494
+3.323
3.32%
1 jan 1988 ano
109.846
+6.353
6.14%
1 jan 1989 ano
113.554
+3.708
3.38%
1 jan 1990 ano
115.596
+2.041
1.8%
1 jan 1991 ano
118.163
+2.567
2.22%
1 jan 1992 ano
117.743
-0.419
-0.35%
1 jan 1993 ano
118.078
+0.334
0.28%
1 jan 1994 ano
119.915
+1.838
1.56%
1 jan 1995 ano
121.9
+1.985
1.65%
1 jan 1996 ano
123.49
+1.59
1.3%
1 jan 1997 ano
125.026
+1.535
1.24%
1 jan 1998 ano
128.166
+3.14
2.51%
1 jan 2002 ano
120.846
-7.32
-5.71%
1 jan 2003 ano
119.187
-1.658
-1.37%
1 jan 2004 ano
118.502
-0.685
-0.57%
1 jan 2005 ano
118.974
+0.471
0.4%
1 jan 2006 ano
126.51
+7.537
6.33%
1 jan 2007 ano
126.295
-0.215
-0.17%
1 jan 2008 ano
123.407
-2.888
-2.29%
1 jan 2009 ano
127.093
+3.685
2.99%
1 jan 2010 ano
135.968
+8.876
6.98%
1 jan 2011 ano
135.64
-0.328
-0.24%
1 jan 2012 ano
132.729
-2.912
-2.15%
1 jan 2013 ano
135.909
+3.18
2.4%
1 jan 2014 ano
130.98
-4.929
-3.63%
1 jan 2015 ano
126.436
-4.544
-3.47%
1 jan 2016 ano
125.081
-1.355
-1.07%
Classificação de países por estatísticas atuais por anos


Comentários: