29
/pt/
pt
AIzaSyAYiBZKx7MnpbEhh9jyipgxe19OcubqV5w
April 1, 2024
177552
Lesotho
LSO
true
2
1
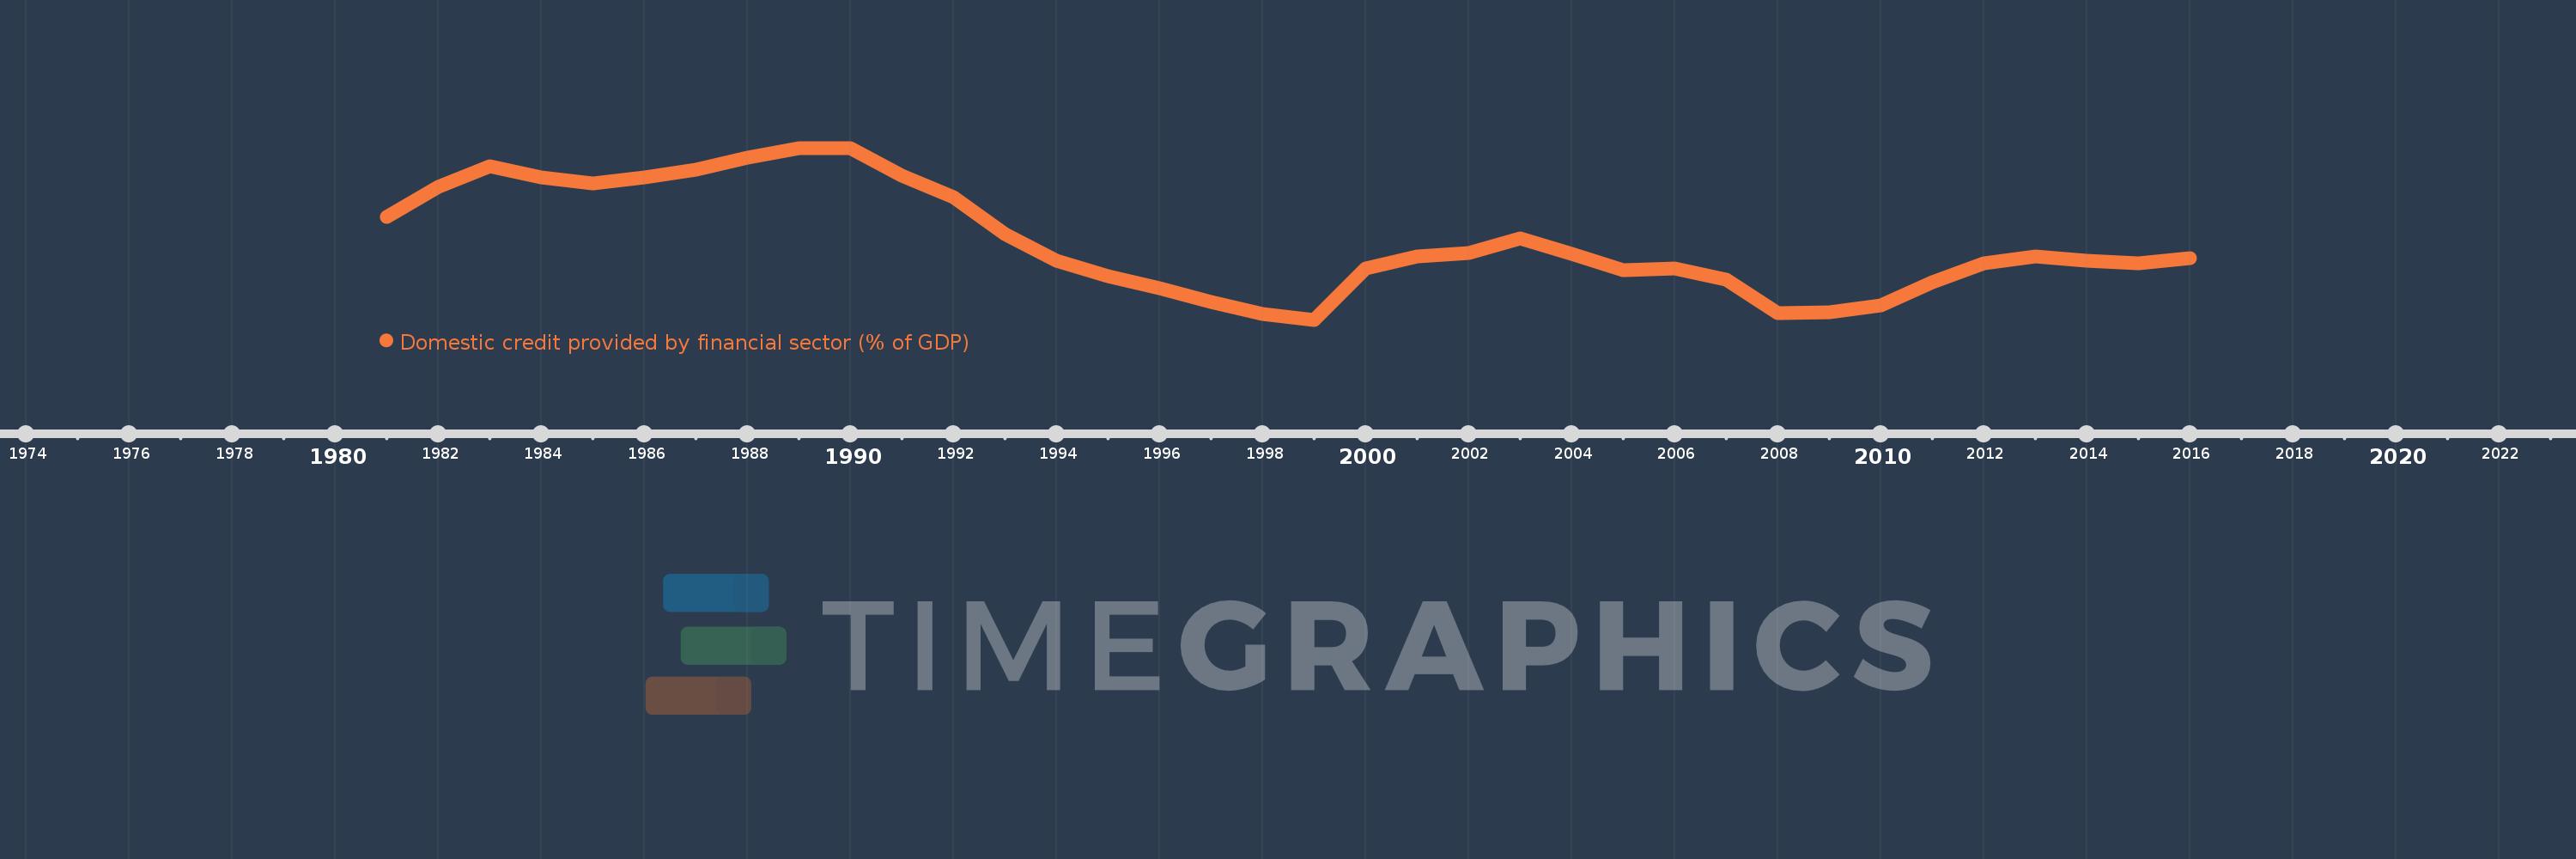
Domestic credit provided by financial sector (% of GDP)
2016,2015,2014,2013,2012,2011,2010,2009,2008,2007,2006,2005,2004,2003,2002,2001,2000,1999,1998,1997,1996,1995,1994,1993,1992,1991,1990,1989,1988,1987,1986,1985,1984,1983,1982,1981
Estas estatísticas em outros países:
AfghanistanAlbaniaAlgeriaAngolaAntigua and BarbudaArab WorldArgentinaArmeniaArubaAustraliaAustriaAzerbaijanBahamas, TheBahrainBangladeshBarbadosBelarusBelgiumBelizeBeninBhutanBoliviaBosnia and HerzegovinaBotswanaBrazilBrunei DarussalamBulgariaBurkina FasoBurundiCabo VerdeCambodiaCameroonCanadaCaribbean small statesCentral African RepublicCentral Europe and the BalticsChadChileChinaColombiaComorosCongo, Dem. Rep.Congo, Rep.Costa RicaCote d'IvoireCroatiaCyprusCzech RepublicDenmarkDjiboutiDominicaDominican RepublicEarly-demographic dividendEast Asia & PacificEast Asia & Pacific (excluding high income)East Asia & Pacific (IDA & IBRD countries)EcuadorEgypt, Arab Rep.El SalvadorEquatorial GuineaEritreaEstoniaEthiopiaEuro areaEurope & Central AsiaEurope & Central Asia (excluding high income)Europe & Central Asia (IDA & IBRD countries)European UnionFijiFinlandFragile and conflict affected situationsFranceGabonGambia, TheGeorgiaGermanyGhanaGreeceGrenadaGuatemalaGuineaGuinea-BissauGuyanaHaitiHeavily indebted poor countries (HIPC)High incomeHondurasHong Kong SAR, ChinaHungaryIBRD onlyIcelandIDA & IBRD totalIDA blendIDA onlyIDA totalIndiaIndonesiaIran, Islamic Rep.IraqIrelandIsraelItalyJamaicaJapanJordanKazakhstanKenyaKorea, Rep.KosovoKuwaitKyrgyz RepublicLao PDRLate-demographic dividendLatin America & Caribbean Latin America & Caribbean (excluding high income)Latin America & the Caribbean (IDA & IBRD countries)LatviaLeast developed countries: UN classificationLebanonLesothoLiberiaLibyaLithuaniaLow & middle incomeLow incomeLower middle incomeLuxembourgMacao SAR, ChinaMacedonia, FYRMadagascarMalawiMalaysiaMaldivesMaliMaltaMauritaniaMauritiusMexicoMicronesia, Fed. Sts.Middle East & North AfricaMiddle East & North Africa (excluding high income)Middle East & North Africa (IDA & IBRD countries)Middle incomeMoldovaMongoliaMontenegroMoroccoMozambiqueMyanmarNamibiaNepalNetherlandsNew ZealandNicaraguaNigerNigeriaNorth AmericaNorwayOECD membersOmanOther small statesPacific island small statesPakistanPanamaPapua New GuineaParaguayPeruPhilippinesPolandPortugalPost-demographic dividendPre-demographic dividendQatarRomaniaRussian FederationRwandaSamoaSao Tome and PrincipeSaudi ArabiaSenegalSerbiaSeychellesSierra LeoneSingaporeSlovak RepublicSloveniaSmall statesSolomon IslandsSouth AfricaSouth AsiaSouth Asia (IDA & IBRD)South SudanSpainSri LankaSt. Kitts and NevisSt. LuciaSt. Vincent and the GrenadinesSub-Saharan Africa Sub-Saharan Africa (excluding high income)Sub-Saharan Africa (IDA & IBRD countries)SudanSurinameSwazilandSwedenSwitzerlandSyrian Arab RepublicTajikistanTanzaniaThailandTimor-LesteTogoTongaTrinidad and TobagoTunisiaTurkeyUgandaUkraineUnited Arab EmiratesUnited KingdomUnited StatesUpper middle incomeUruguayVanuatuVenezuela, RBVietnamWest Bank and GazaWorldYemen, Rep.ZambiaZimbabwe Linha do tempo:
Nesta escala de tempo está apresentado um gráfico de 1981 ano até 2016 ano Lesotho. Dados de 1980 ano ausente. O número de observações reais por data: 36.
Fonte (nome):
Indicadores de desenvolvimento mundial
Fonte (organização):
International Monetary Fund, International Financial Statistics and data files, and World Bank and OECD GDP estimates.
Categorias:
Financial Sector
Foi atualizado:
23 abr 2017 ano
Indicadores de alterações dos valores ao longo dos anos
Mínimo:
-18.422
1 jan 1999 ano
Máximo:
39.882
1 jan 1989 ano
Na data de observação
Valor
Mudança absoluta
A alteração em relação ao valor anterior
1 jan 1981 ano
16.432
+16.432
0.0%
1 jan 1982 ano
26.752
+10.32
62.8%
1 jan 1983 ano
33.609
+6.856
25.63%
1 jan 1984 ano
29.973
-3.636
-10.82%
1 jan 1985 ano
27.756
-2.217
-7.4%
1 jan 1986 ano
29.785
+2.028
7.31%
1 jan 1987 ano
32.379
+2.594
8.71%
1 jan 1988 ano
36.633
+4.254
13.14%
1 jan 1989 ano
39.882
+3.249
8.87%
1 jan 1990 ano
39.844
-0.038
-0.09%
1 jan 1991 ano
30.572
-9.272
-23.27%
1 jan 1992 ano
23.258
-7.314
-23.92%
1 jan 1993 ano
10.712
-12.546
-53.94%
1 jan 1994 ano
1.478
-9.234
-86.2%
1 jan 1995 ano
-3.642
-5.12
-346.37%
1 jan 1996 ano
-7.731
-4.089
112.29%
1 jan 1997 ano
-12.36
-4.629
59.88%
1 jan 1998 ano
-16.427
-4.066
32.9%
1 jan 1999 ano
-18.422
-1.996
12.15%
1 jan 2000 ano
-0.991
+17.431
-94.62%
1 jan 2001 ano
3.144
+4.135
-417.22%
1 jan 2002 ano
4.294
+1.149
36.55%
1 jan 2003 ano
9.137
+4.843
112.81%
1 jan 2004 ano
3.887
-5.25
-57.46%
1 jan 2005 ano
-1.504
-5.391
-138.69%
1 jan 2006 ano
-0.939
+0.565
-37.55%
1 jan 2007 ano
-4.732
-3.793
403.78%
1 jan 2008 ano
-16.104
-11.372
240.31%
1 jan 2009 ano
-15.911
+0.193
-1.2%
1 jan 2010 ano
-13.481
+2.43
-15.27%
1 jan 2011 ano
-5.715
+7.767
-57.61%
1 jan 2012 ano
0.628
+6.342
-110.99%
1 jan 2013 ano
2.923
+2.295
365.57%
1 jan 2014 ano
1.616
-1.307
-44.71%
1 jan 2015 ano
0.622
-0.994
-61.53%
1 jan 2016 ano
2.556
+1.934
311.2%
Classificação de países por estatísticas atuais por anos


Comentários: