29
/pt/
pt
AIzaSyAYiBZKx7MnpbEhh9jyipgxe19OcubqV5w
April 1, 2024
49921
Middle East & North Africa (IDA & IBRD countries)
TMN
false
2
1
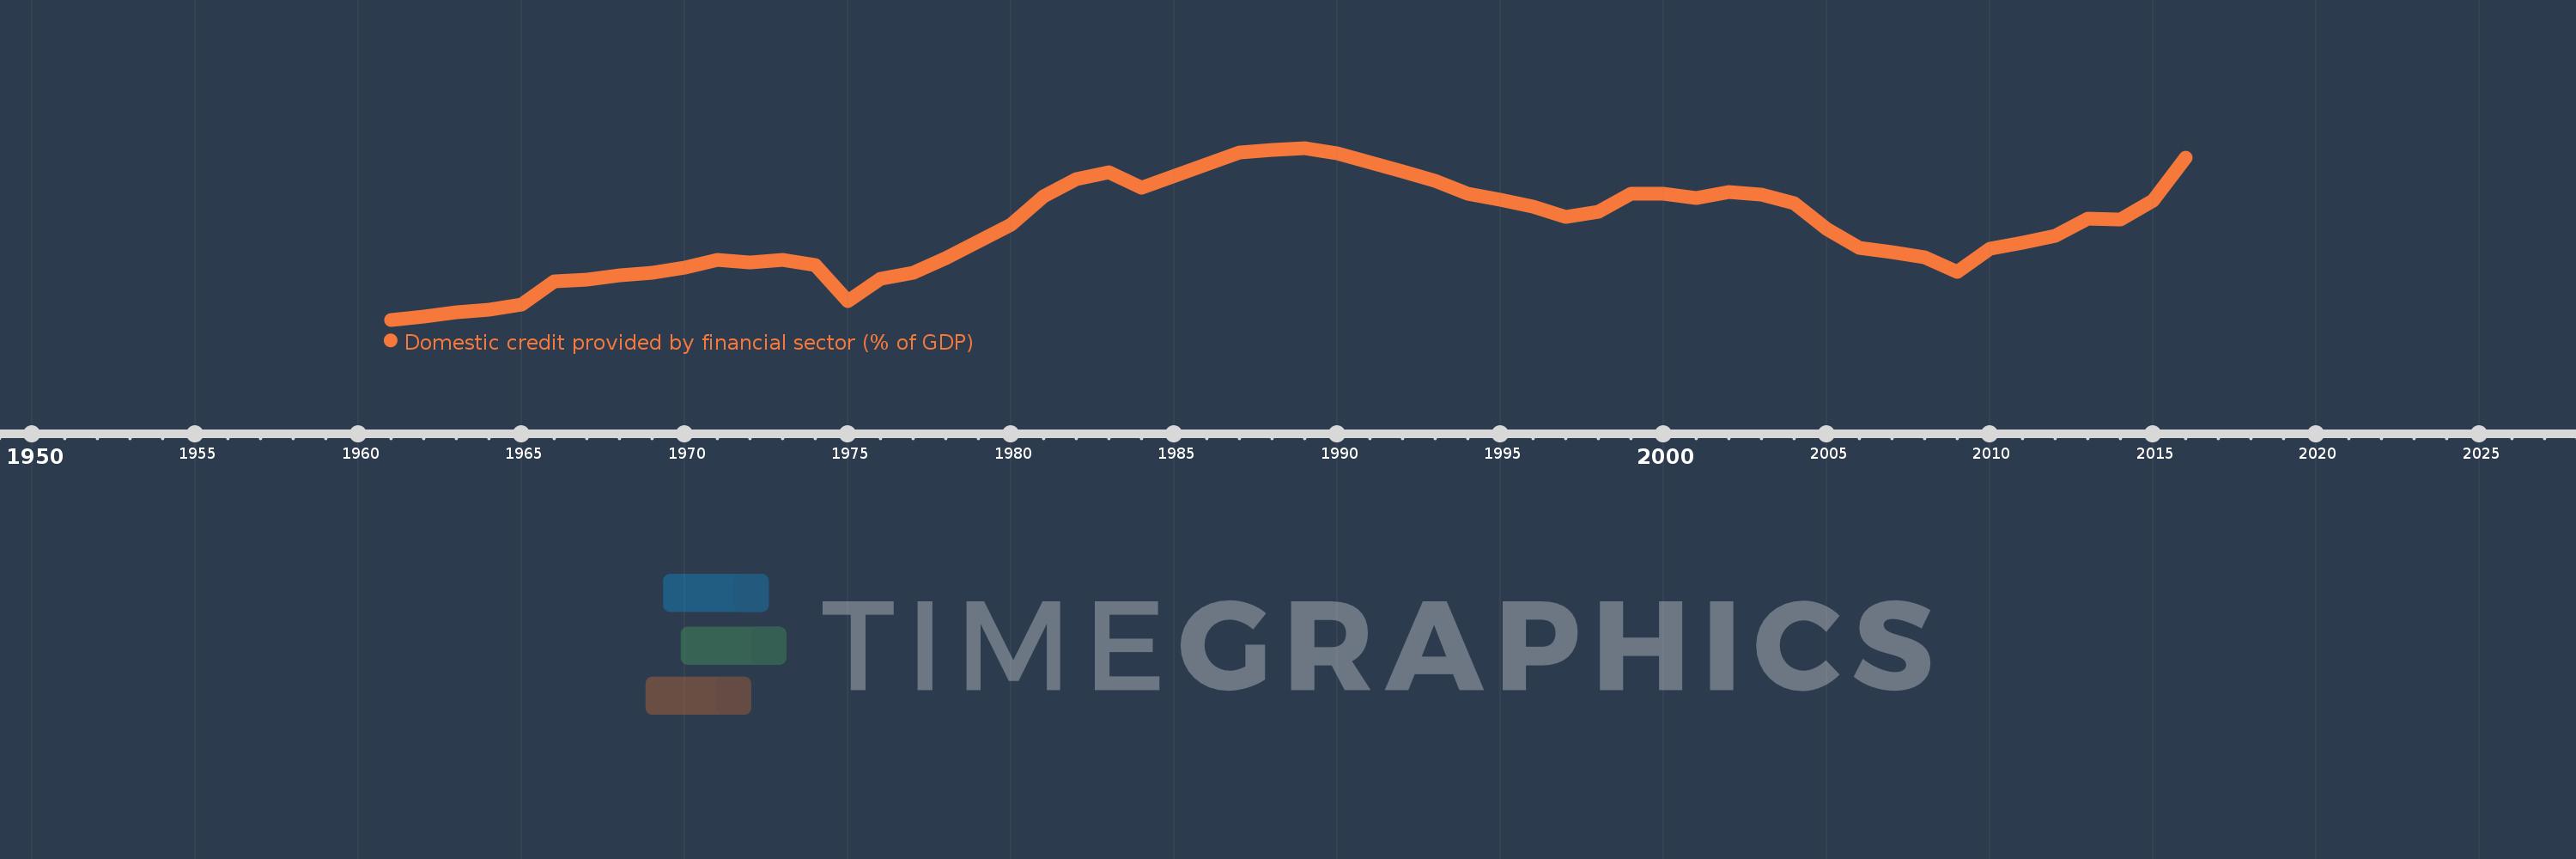
Domestic credit provided by financial sector (% of GDP)
2016,2015,2014,2013,2012,2011,2010,2009,2008,2007,2006,2005,2004,2003,2002,2001,2000,1999,1998,1997,1996,1995,1994,1993,1992,1990,1989,1988,1987,1984,1983,1982,1981,1980,1978,1977,1976,1975,1974,1973,1972,1971,1970,1969,1968,1967,1966,1965,1964,1963,1962,1961
Estas estatísticas em outros países:
AfghanistanAlbaniaAlgeriaAngolaAntigua and BarbudaArab WorldArgentinaArmeniaArubaAustraliaAustriaAzerbaijanBahamas, TheBahrainBangladeshBarbadosBelarusBelgiumBelizeBeninBhutanBoliviaBosnia and HerzegovinaBotswanaBrazilBrunei DarussalamBulgariaBurkina FasoBurundiCabo VerdeCambodiaCameroonCanadaCaribbean small statesCentral African RepublicCentral Europe and the BalticsChadChileChinaColombiaComorosCongo, Dem. Rep.Congo, Rep.Costa RicaCote d'IvoireCroatiaCyprusCzech RepublicDenmarkDjiboutiDominicaDominican RepublicEarly-demographic dividendEast Asia & PacificEast Asia & Pacific (excluding high income)East Asia & Pacific (IDA & IBRD countries)EcuadorEgypt, Arab Rep.El SalvadorEquatorial GuineaEritreaEstoniaEthiopiaEuro areaEurope & Central AsiaEurope & Central Asia (excluding high income)Europe & Central Asia (IDA & IBRD countries)European UnionFijiFinlandFragile and conflict affected situationsFranceGabonGambia, TheGeorgiaGermanyGhanaGreeceGrenadaGuatemalaGuineaGuinea-BissauGuyanaHaitiHeavily indebted poor countries (HIPC)High incomeHondurasHong Kong SAR, ChinaHungaryIBRD onlyIcelandIDA & IBRD totalIDA blendIDA onlyIDA totalIndiaIndonesiaIran, Islamic Rep.IraqIrelandIsraelItalyJamaicaJapanJordanKazakhstanKenyaKorea, Rep.KosovoKuwaitKyrgyz RepublicLao PDRLate-demographic dividendLatin America & Caribbean Latin America & Caribbean (excluding high income)Latin America & the Caribbean (IDA & IBRD countries)LatviaLeast developed countries: UN classificationLebanonLesothoLiberiaLibyaLithuaniaLow & middle incomeLow incomeLower middle incomeLuxembourgMacao SAR, ChinaMacedonia, FYRMadagascarMalawiMalaysiaMaldivesMaliMaltaMauritaniaMauritiusMexicoMicronesia, Fed. Sts.Middle East & North AfricaMiddle East & North Africa (excluding high income)Middle East & North Africa (IDA & IBRD countries)Middle incomeMoldovaMongoliaMontenegroMoroccoMozambiqueMyanmarNamibiaNepalNetherlandsNew ZealandNicaraguaNigerNigeriaNorth AmericaNorwayOECD membersOmanOther small statesPacific island small statesPakistanPanamaPapua New GuineaParaguayPeruPhilippinesPolandPortugalPost-demographic dividendPre-demographic dividendQatarRomaniaRussian FederationRwandaSamoaSao Tome and PrincipeSaudi ArabiaSenegalSerbiaSeychellesSierra LeoneSingaporeSlovak RepublicSloveniaSmall statesSolomon IslandsSouth AfricaSouth AsiaSouth Asia (IDA & IBRD)South SudanSpainSri LankaSt. Kitts and NevisSt. LuciaSt. Vincent and the GrenadinesSub-Saharan Africa Sub-Saharan Africa (excluding high income)Sub-Saharan Africa (IDA & IBRD countries)SudanSurinameSwazilandSwedenSwitzerlandSyrian Arab RepublicTajikistanTanzaniaThailandTimor-LesteTogoTongaTrinidad and TobagoTunisiaTurkeyUgandaUkraineUnited Arab EmiratesUnited KingdomUnited StatesUpper middle incomeUruguayVanuatuVenezuela, RBVietnamWest Bank and GazaWorldYemen, Rep.ZambiaZimbabwe Linha do tempo:
Nesta escala de tempo está apresentado um gráfico de 1961 ano até 2016 ano Middle East & North Africa (IDA & IBRD countries). Dados de 1960 ano ausente. O número de observações reais por data: 52.
Fonte (nome):
Indicadores de desenvolvimento mundial
Fonte (organização):
International Monetary Fund, International Financial Statistics and data files, and World Bank and OECD GDP estimates.
Categorias:
Financial Sector
Foi atualizado:
23 abr 2017 ano
Indicadores de alterações dos valores ao longo dos anos
Mínimo:
18.359
1 jan 1961 ano
Máximo:
78.473
1 jan 1989 ano
Na data de observação
Valor
Mudança absoluta
A alteração em relação ao valor anterior
1 jan 1961 ano
18.359
+18.359
0.0%
1 jan 1962 ano
19.505
+1.146
6.24%
1 jan 1963 ano
21.096
+1.592
8.16%
1 jan 1964 ano
21.961
+0.864
4.1%
1 jan 1965 ano
23.668
+1.707
7.77%
1 jan 1966 ano
31.746
+8.078
34.13%
1 jan 1967 ano
32.306
+0.56
1.77%
1 jan 1968 ano
33.984
+1.678
5.2%
1 jan 1969 ano
34.9
+0.915
2.69%
1 jan 1970 ano
36.625
+1.725
4.94%
1 jan 1971 ano
39.238
+2.613
7.13%
1 jan 1972 ano
38.453
-0.785
-2.0%
1 jan 1973 ano
39.429
+0.977
2.54%
1 jan 1974 ano
37.426
-2.003
-5.08%
1 jan 1975 ano
24.778
-12.648
-33.79%
1 jan 1976 ano
32.738
+7.96
32.12%
1 jan 1977 ano
34.728
+1.99
6.08%
1 jan 1978 ano
39.841
+5.113
14.72%
1 jan 1980 ano
51.771
+11.929
29.94%
1 jan 1981 ano
61.436
+9.665
18.67%
1 jan 1982 ano
67.611
+6.174
10.05%
1 jan 1983 ano
70.004
+2.393
3.54%
1 jan 1984 ano
64.509
-5.495
-7.85%
1 jan 1987 ano
77.006
+12.498
19.37%
1 jan 1988 ano
77.862
+0.856
1.11%
1 jan 1989 ano
78.473
+0.611
0.78%
1 jan 1990 ano
76.624
-1.849
-2.36%
1 jan 1992 ano
70.342
-6.282
-8.2%
1 jan 1993 ano
66.922
-3.42
-4.86%
1 jan 1994 ano
62.537
-4.385
-6.55%
1 jan 1995 ano
60.364
-2.172
-3.47%
1 jan 1996 ano
58.063
-2.301
-3.81%
1 jan 1997 ano
54.35
-3.713
-6.4%
1 jan 1998 ano
56.22
+1.87
3.44%
1 jan 1999 ano
62.505
+6.285
11.18%
1 jan 2000 ano
62.48
-0.025
-0.04%
1 jan 2001 ano
61.021
-1.459
-2.33%
1 jan 2002 ano
63.112
+2.09
3.43%
1 jan 2003 ano
62.079
-1.033
-1.64%
1 jan 2004 ano
59.071
-3.008
-4.85%
1 jan 2005 ano
50.193
-8.878
-15.03%
1 jan 2006 ano
43.653
-6.539
-13.03%
1 jan 2007 ano
42.107
-1.547
-3.54%
1 jan 2008 ano
40.221
-1.886
-4.48%
1 jan 2009 ano
35.007
-5.213
-12.96%
1 jan 2010 ano
43.304
+8.297
23.7%
1 jan 2011 ano
45.177
+1.873
4.32%
1 jan 2012 ano
47.676
+2.5
5.53%
1 jan 2013 ano
53.737
+6.061
12.71%
1 jan 2014 ano
53.546
-0.191
-0.36%
1 jan 2015 ano
60.15
+6.604
12.33%
1 jan 2016 ano
75.216
+15.066
25.05%
Classificação de países por estatísticas atuais por anos


Comentários: